I did a quick dive this last weekend into the newest state-level United States employment datasets. The data you see here comes from the raw Bureau of Labor Statistics (BLS) SM time series datasets. This post gives a short general overview of the state-level employment situation with some historic context.
Employment in Large States
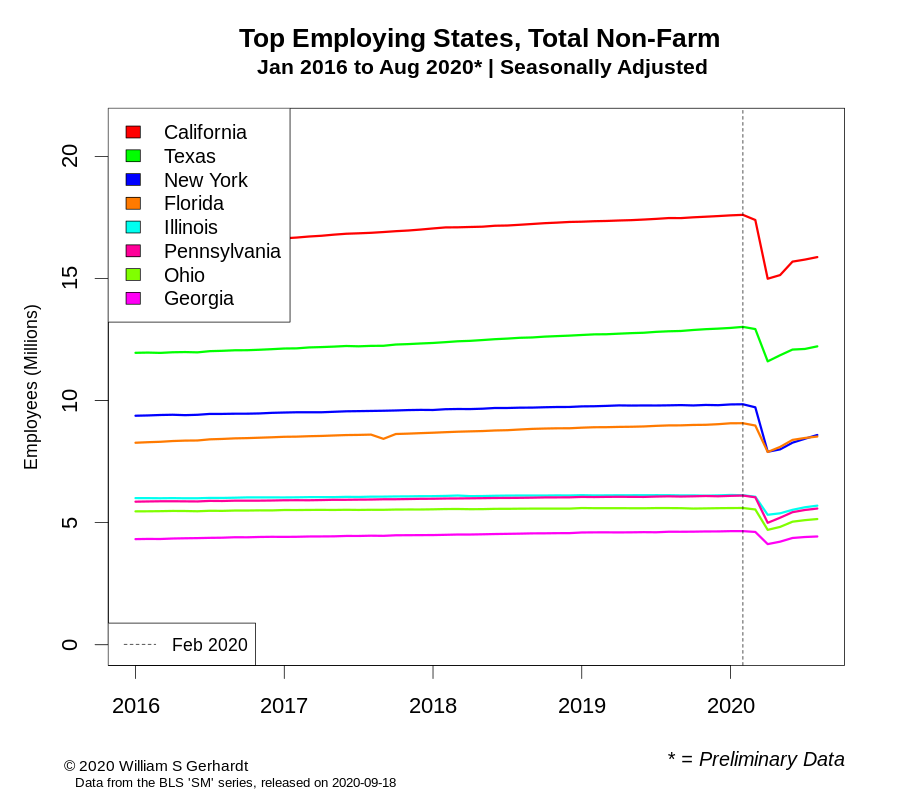
This is what the current data looks like for the 8 states with the largest nonfarm employment:
This is what the month-to-month comparison looks like contrasting the state-level data from February 2020 (just before the start of COVID-19 shutdowns) with the preliminary data from August 2020:
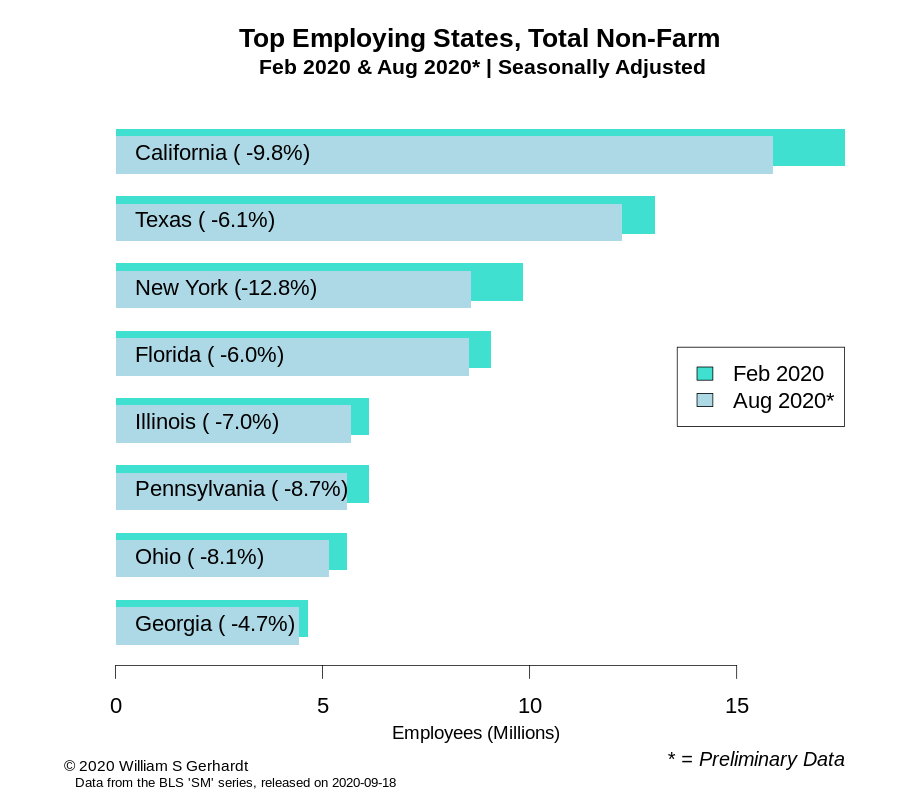
No large state has recovered the employees shed during the early months of the COVID-19 pandemic. And even with some job recovery in some states, the overall employment situation is still far worse than the 2008 economic crisis was at its peak (see the section further below for more).
Employment in Small States
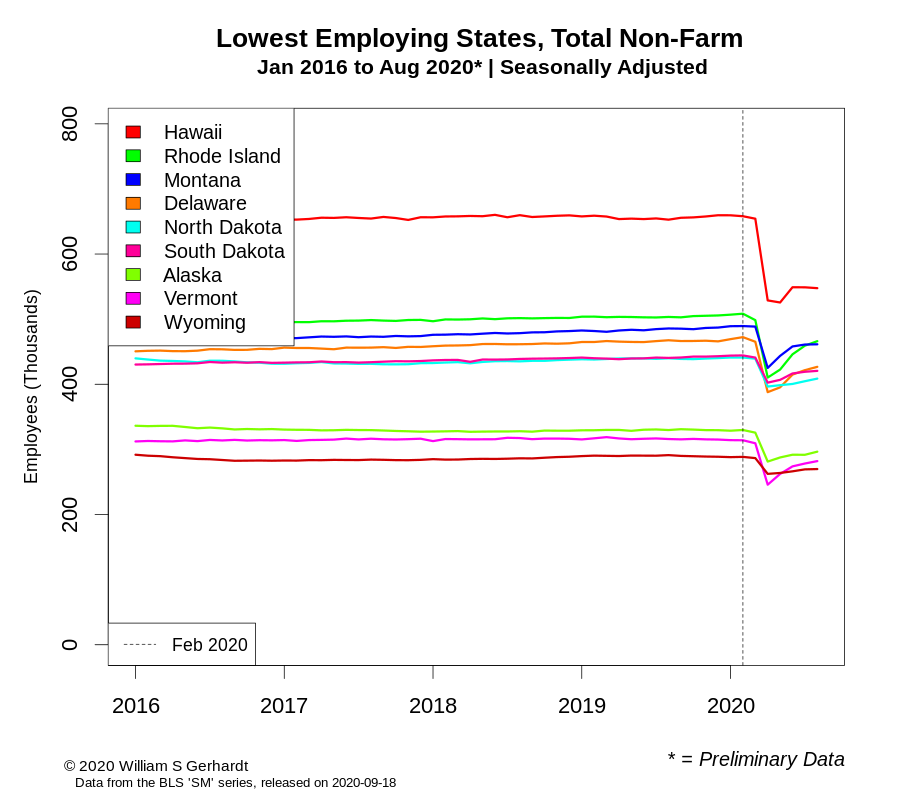
The smallest 9 states by employment are not performing better than the largest employing states. And with regards to Hawaii the situation looks very bad:
A direct comparison of last month’s employment with the employment situation before COVID-19 drives the hurt home:
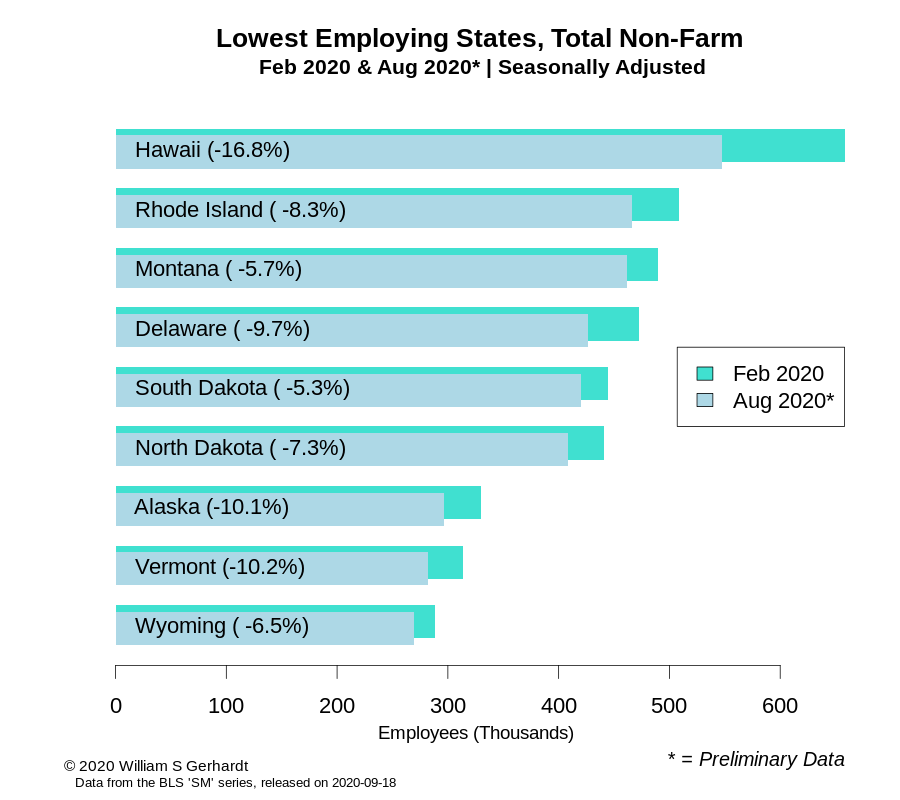
Hawaii is currently the worst-hit state in the nation in terms of having a large and sustained drop in overall employment. Vermont and Alaska are also still suffering from continuing double-digit drops in seasonally adjusted employment.
The Current Situation vs The 2008 Economic Crisis
To give some historic context, the current drop in employment—occurring very early in the recession—is significantly worse than the peak-to-trough period that occurred in the wake of the 2008 Financial Crisis. The current drop in 2020 is both steeper and deeper.
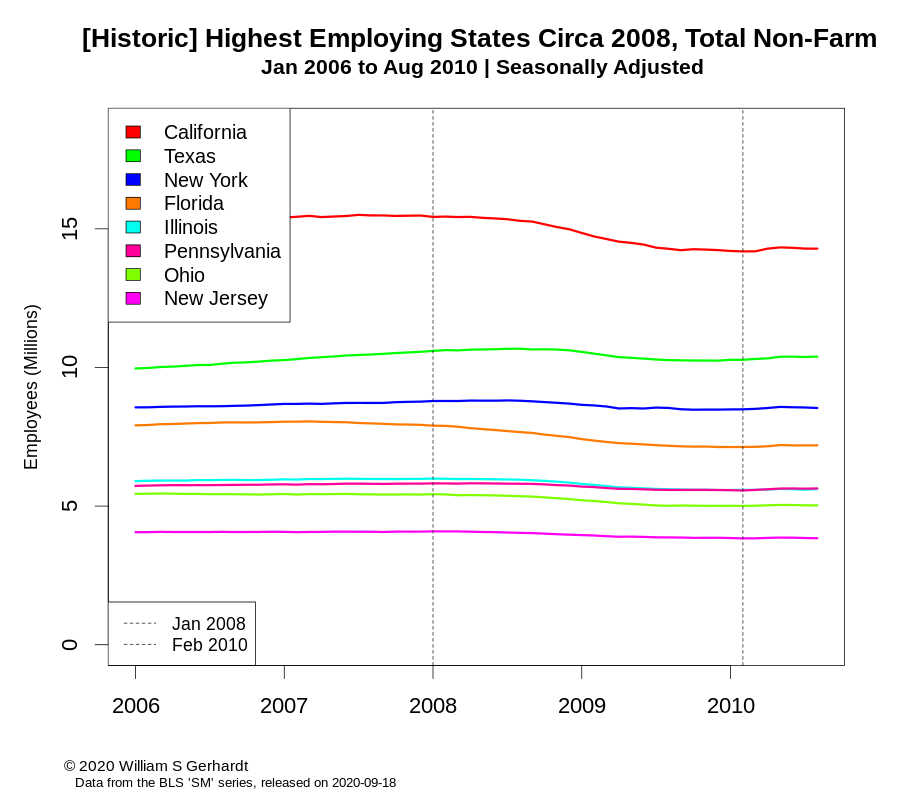
For purely nostalgic purposes, here is what the U.S. employment situation looked like in some of the largest states back in the good ‘ol days of 2008; when the only thing we had to worry about was the world financial system collapsing:
And here is a barchat comparing the best month of national employment just before the 2008 financial crisis hit (January 2008) and the worst month for national employment in the period following the crisis (February 2010):
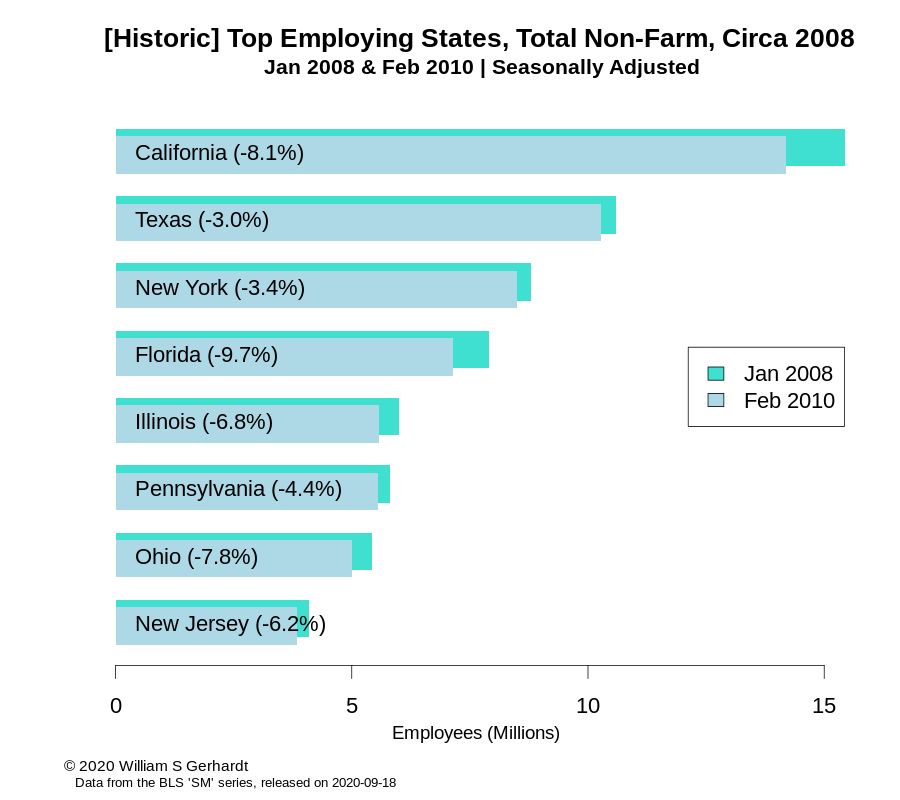
The Texas and Pennsylvania employment losses today are, in percentage terms, almost twice what they were during the 2008 economic crisis (at least when comparing January 2008 & February 2010; when national seasonally-adjusted employment was at its relative high and low).
The current (preliminary) August 2020 numbers for New York state show an employment situation 4x worse than it was during the 2008 recession. Pennsylvania’s employment situation is currently 2x worse than the 2008 situation, even with some recovery.
Only Florida is doing better than it did back during the last recession, currently down only a modest 6% compared to peak Feb 2020 employment; compared with the 9.7% employment drop it suffered during the 2008 crisis’s nadir.
Summary
Given that we are still technically in the middle of a wide-ranging and still-unfolding pandemic it’s probably not surprising that the post-shutdown economic rebound is looking less like a ‘V’ and more like a deformed ‘L’: a striking drop followed by what looks like a slow and possibly fleeting recovery.
It’s anyone’s guess what will happen this fall and winter, but so far things are not looking too good: Congress let emergency COVID-19 supplemental economic aid expire in late July, and without new Federal support cash-strapped state and local governments may start shedding workers.
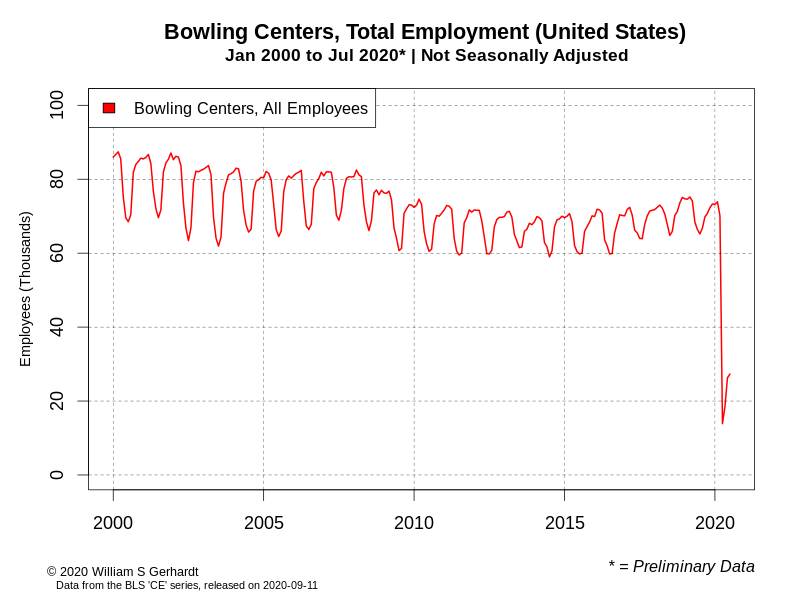
Further complicating the prospect of a rapid and full recovery on the employment front, polls from earlier in the crisis suggest that the vast majority of Americans were unlikely to return to normal routines until the pandemic subsided. This sounds reasonable: who, after all, would risk their life or their health just to go bowling?
Up Next…
I’m officially back from my blog-posting hiatus with new data and new tools. A future post will take a deeper look at the BLS State-level employment data and will show which industries are suffering the most from the COVID downturn, and in which states. I will also be taking a detailed look at the employment situation in Hawaii.