The Bureau of Labor Statistics (BLS) released new employment data this morning for nationwide non-farm employment. The initial take:
- All major BLS sectors—with the exception of the Federal government—are still down significantly from their peak employment in February 2020.
- In the private sector, only the Financial Services industries are close to reaching pre-COVID employment numbers.
- Leisure and Hospitality industries are still experiencing double-digit employment losses compared to their seasonally adjusted peak in February 2020, though the rate of employment growth was up slightly in September.
Here are four auto-generated charts I produced using Python and R (using a custom data framework I wrote) that captures the gist of things.
Chart 1: The seasonally adjusted national values for all major industries
There continues to be sustained and widespread employment losses in all private sector industries, and no sign of a V-shaped recovery. Both Federal and local governments are also now shedding jobs. (You can click any image for a higher-res version.)
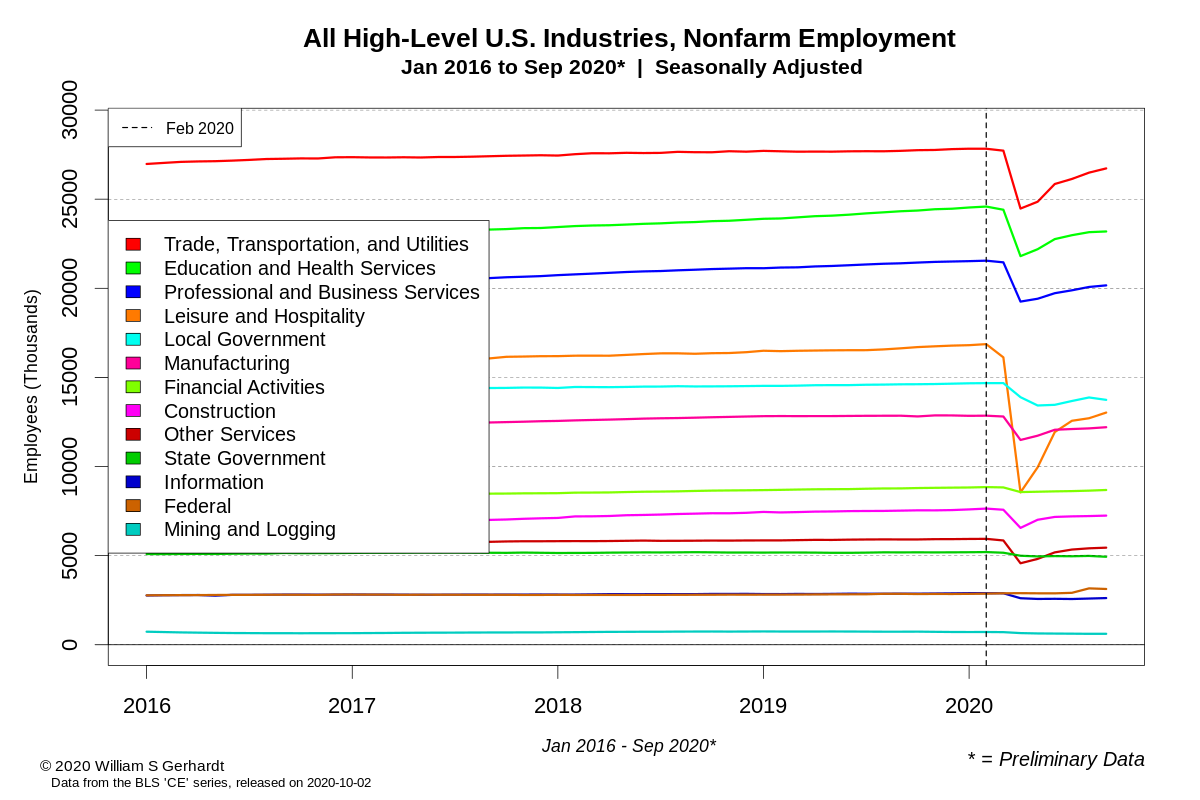
Chart 2: A comparison of August 2020 & September 2020 industry employment
Nothing very exciting happened last month, with the exception of the growing local government job losses.
Two things of note though: the “Information” industry (which includes the Motion Picture industry) is up 1% compared to last month, and the “Leisure and Hospitality” industries are showing some continued signs of life, up 2.5% from the prior month.
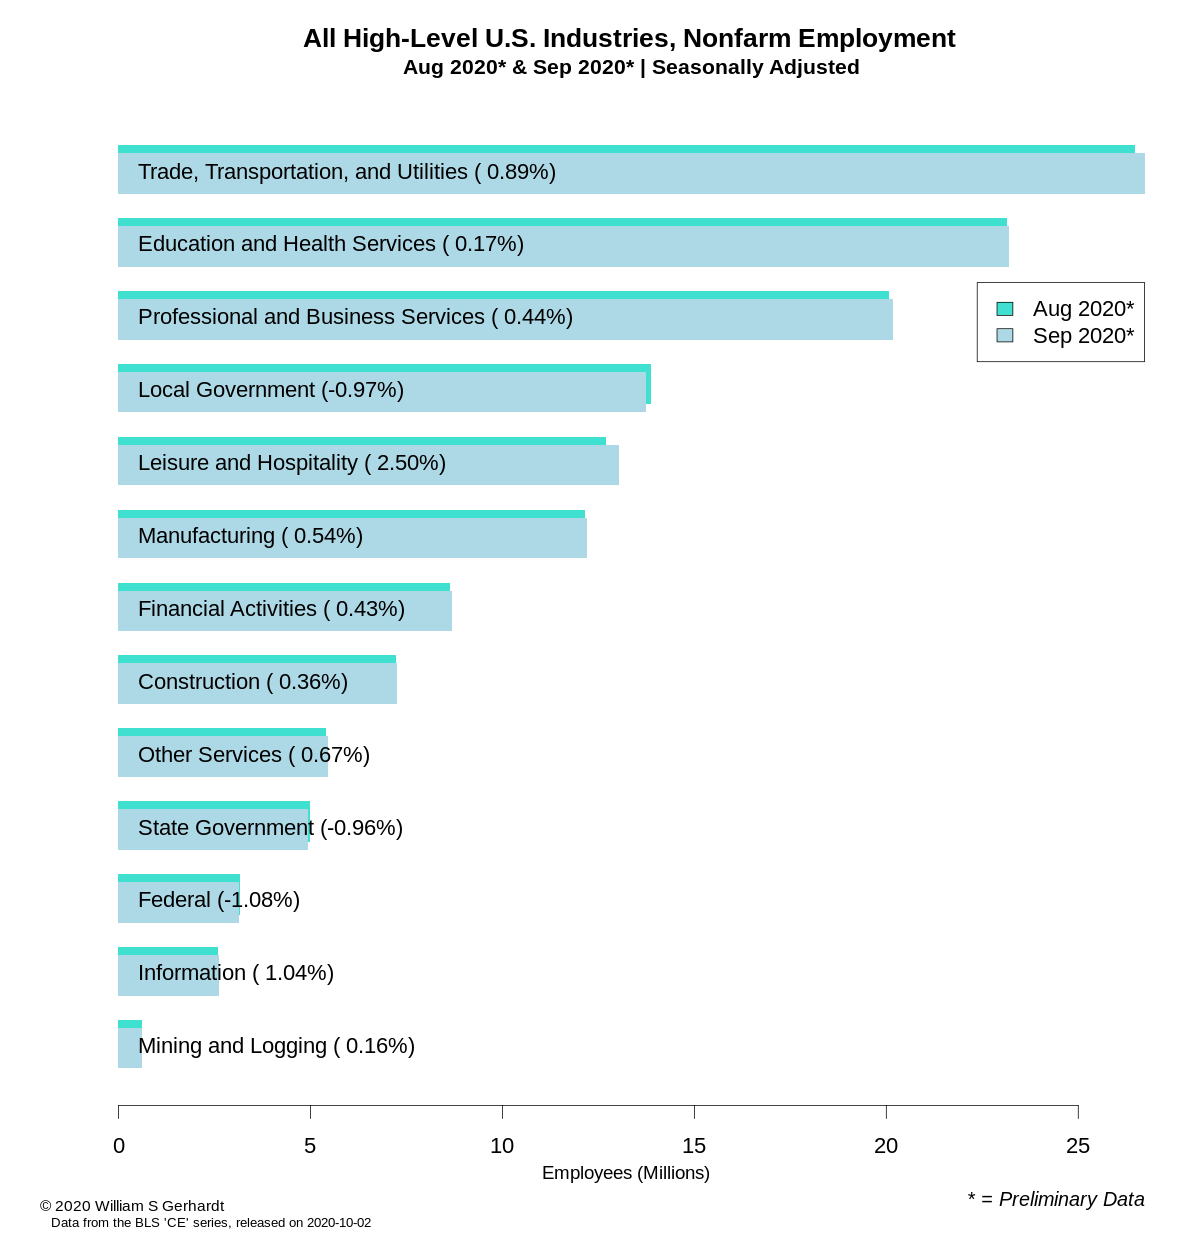
Chart 3: An index of all major BLS industry sectors, with a baseline of February 2020
To read the next two charts properly, recognize that a value of 100 would mean that the employment situation for a given industry is unchanged compared to what it was in February 2020, with no losses and no gains. A value of 50 would mean that the employment for a given industry is 50% of what it was in Feb 2020, and a value of 150 would mean that the industry, in that month, was at 150% of the February 2020 seasonally adjusted employment levels.
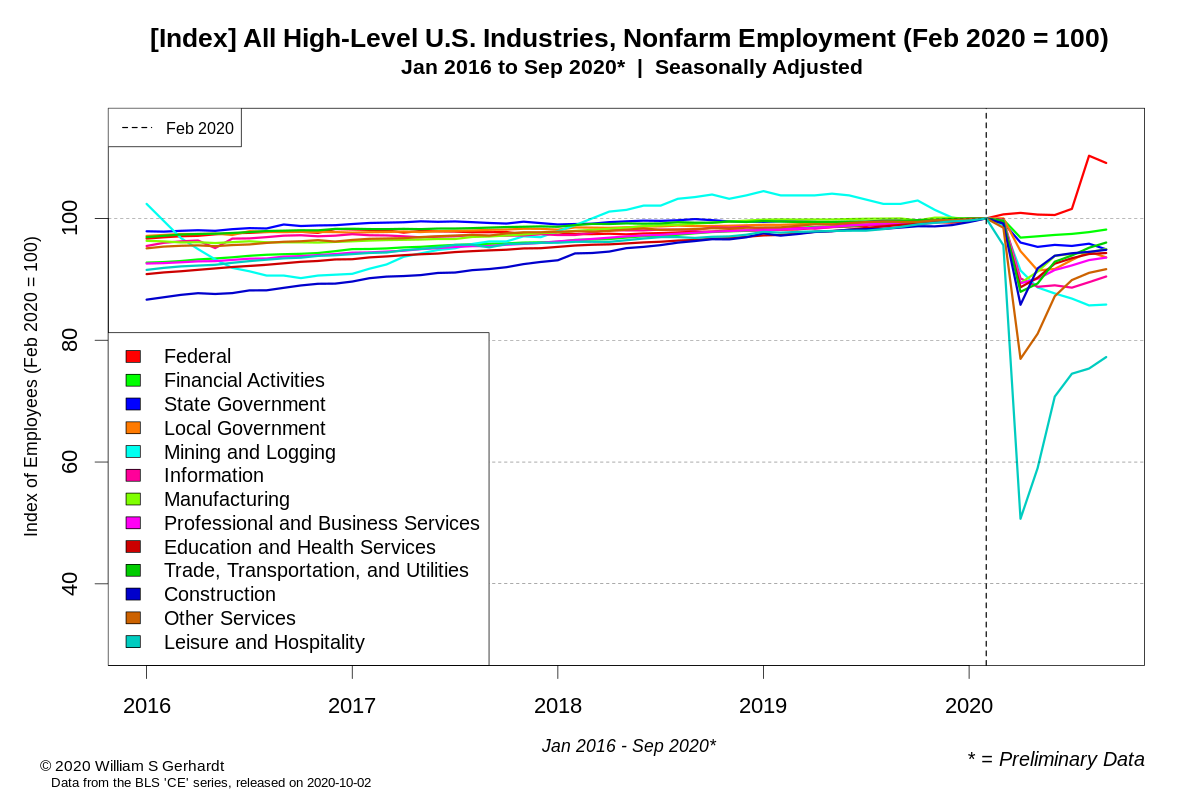
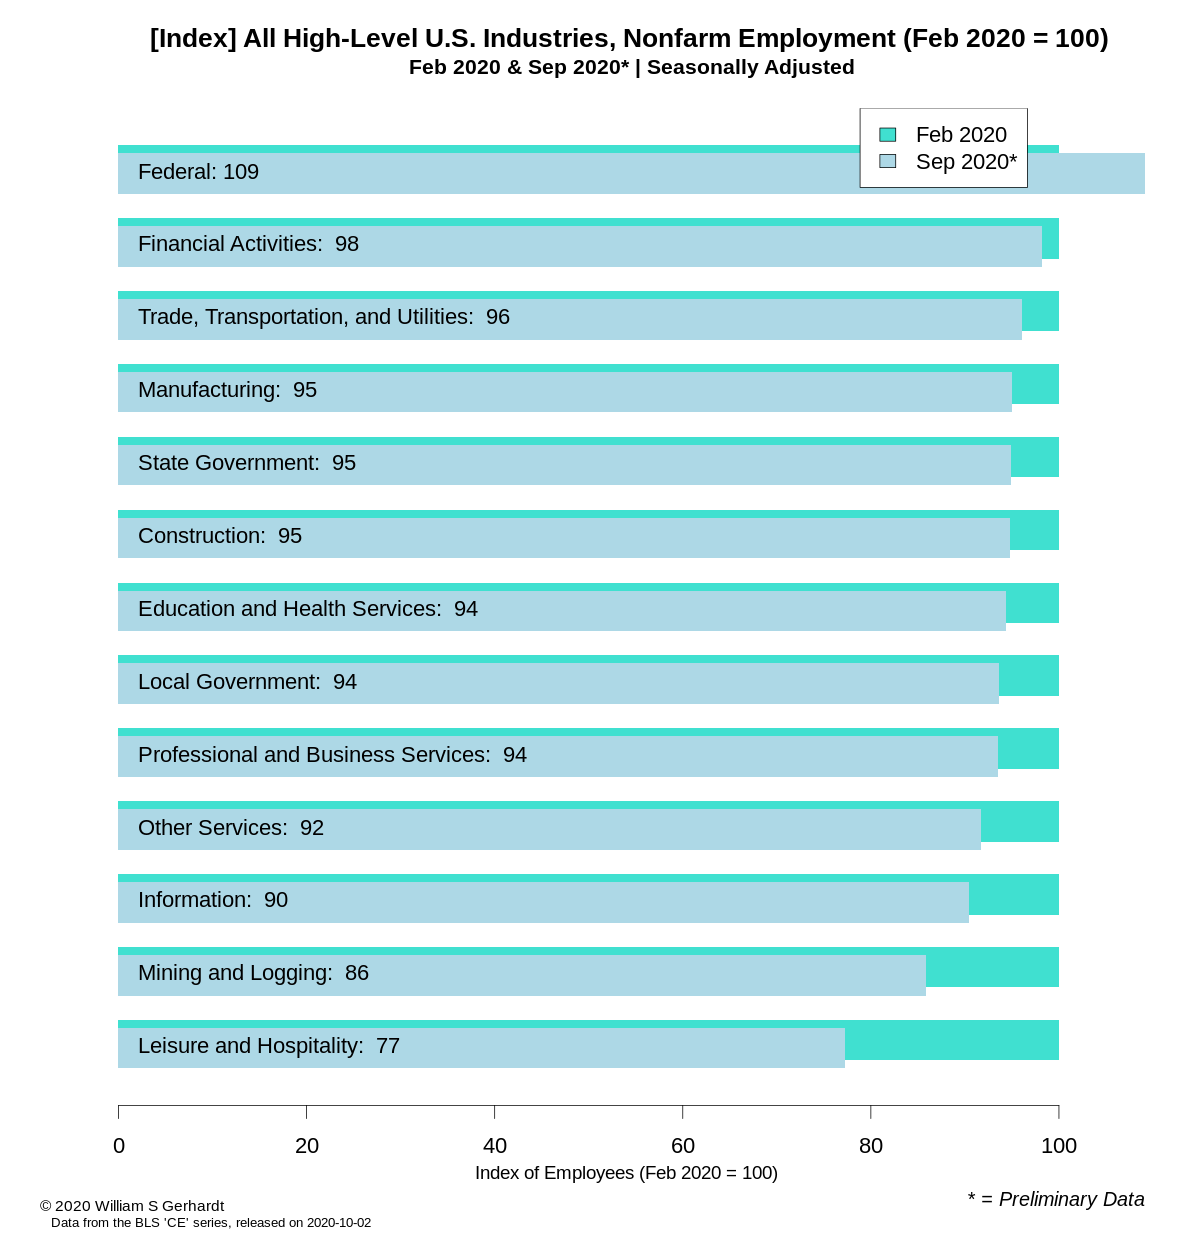
Chart 4: A barplot representation of the September 2020 index values
Please see the note below Chart 3 to properly understand the index values here. As stated multiple places, the baseline is “February 2020 = 100”. The lower the industry is on the list (and the lower it’s September 2020 index value) the further away it is from February 2020 employment levels. The very small “Mining and Logging” sector appears to be doing quite poorly at the moment.
That’s all for now. I have some additional posts coming up that look at state-level data from August (as the September 2020 state-level data won’t be available until later in the month). Stay tuned.