Background: The Summer Rebound
Something amazing happened in the U.S. labor market in May and June of 2020. After national seasonally adjusted employment dropped in April 2020 by the largest percentage since the Bureau of Labor Statistics (BLS) kept records, the U.S. encountered unprecedented gains in employment in late spring and early summer. It almost looked—for a brief moment—as if COVID-19 had vanished and the economy was returning to its February 2020 employment state.
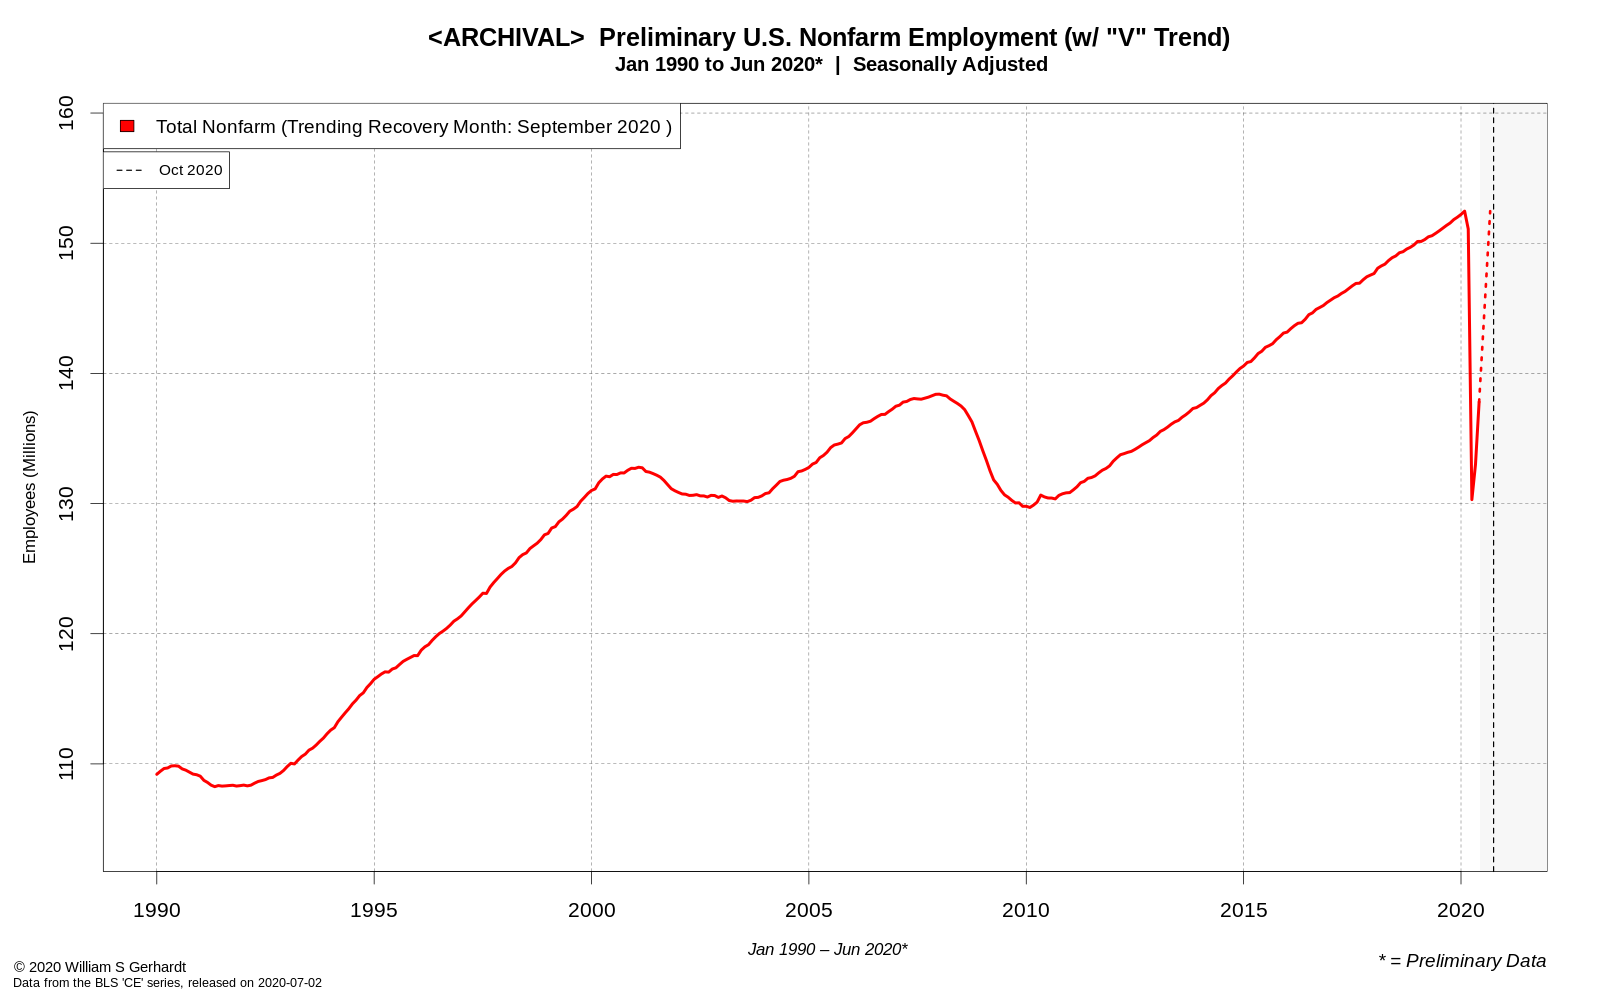
Here is what the BLS data release from July looked like, complete with a trend line I added to show the trajectory employment growth was on in June 2020, based on the preliminary BLS numbers at the time:
And here is what the industry situation looked like back in July 2020 (with preliminary BLS data), based on the rate of employment growth from June 2020, for major high-level industries:
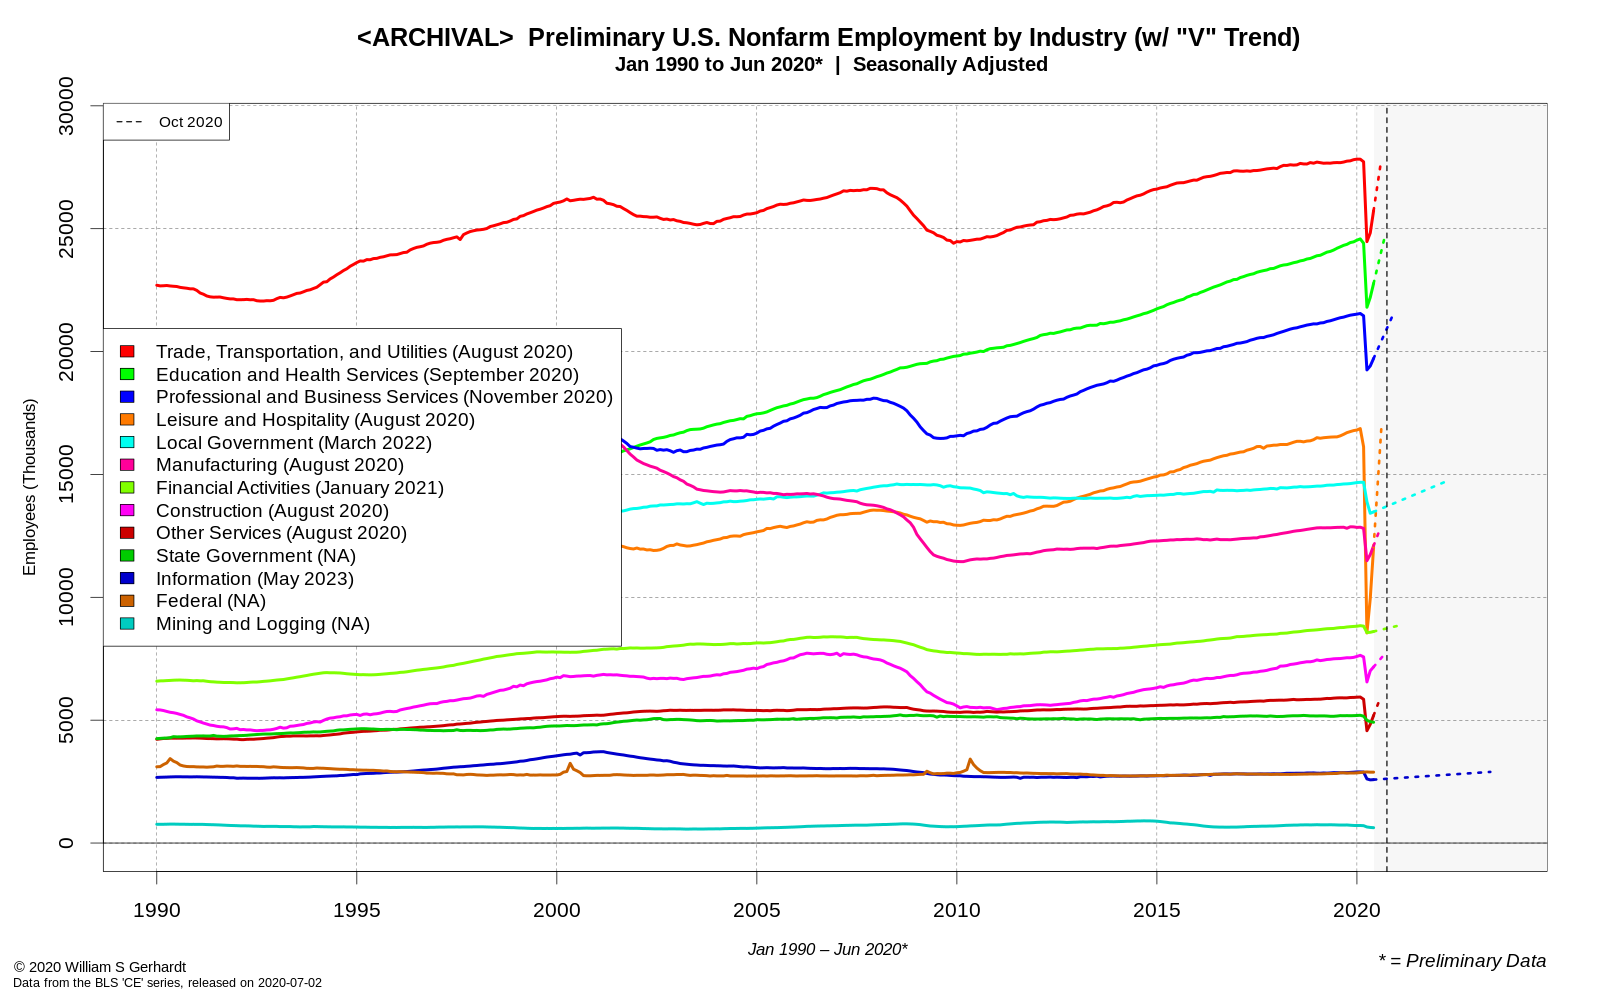
The rate of employment growth for June 2020 seemed to suggest almost every major US industry could possibly return to February 2020 employment levels by October 2020, with only a handful of sectors (including the “Information” sector, which contains the film industry) failing to recover quickly.
An Unprecedented Period in American Employment History
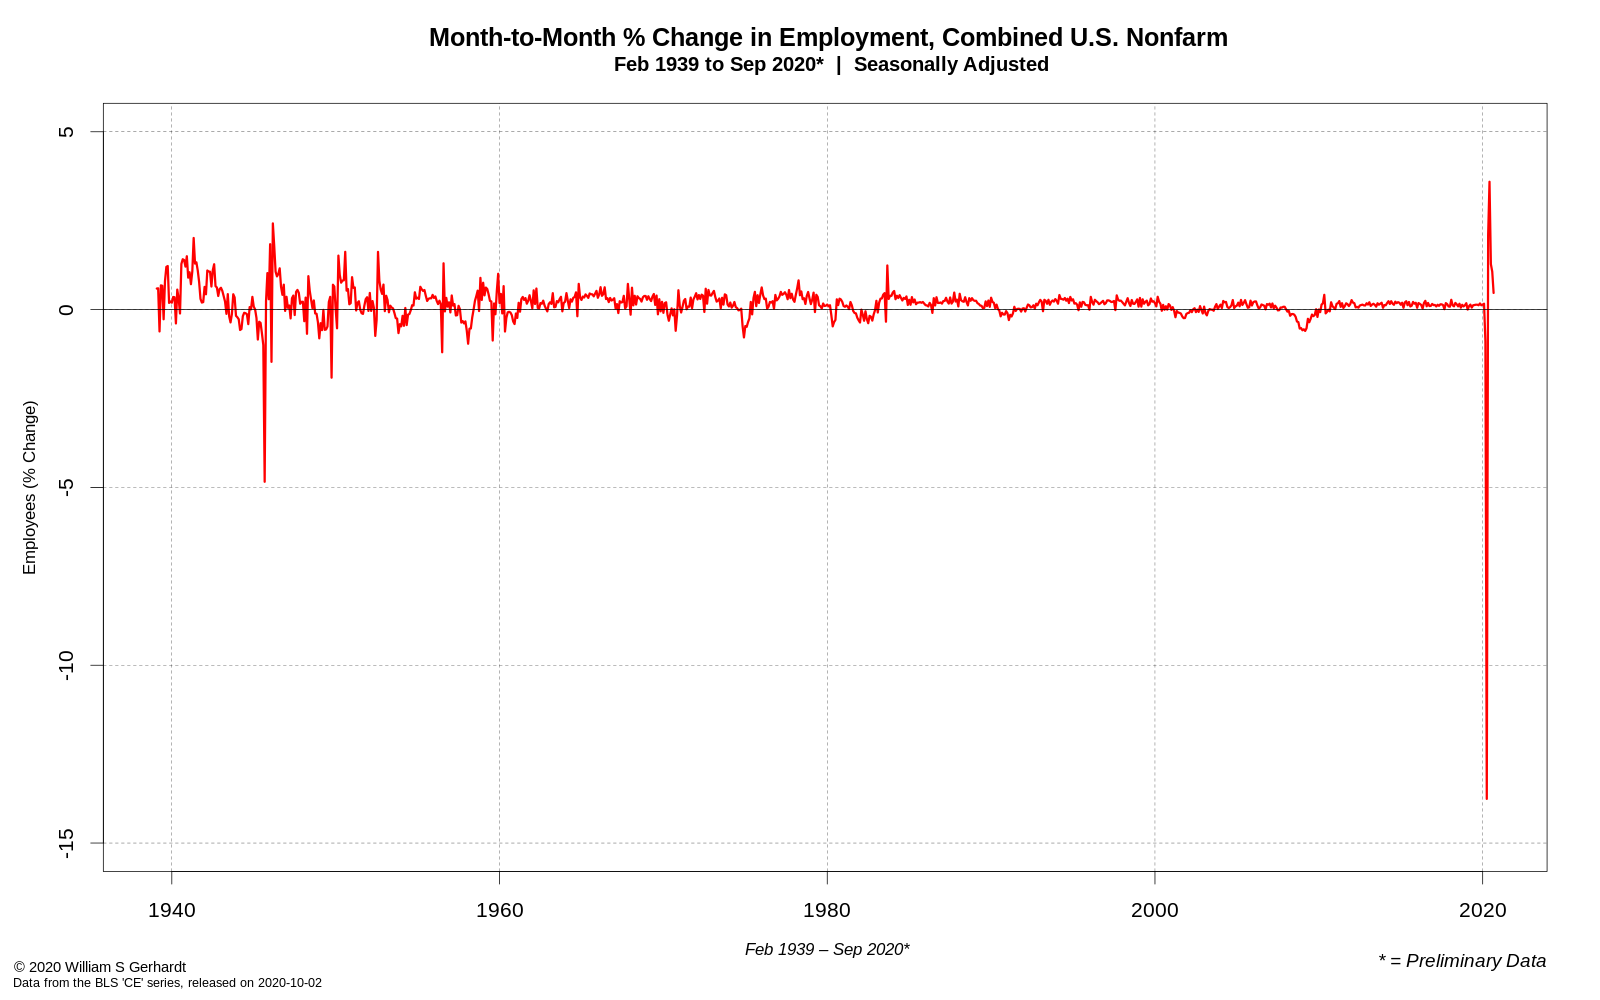
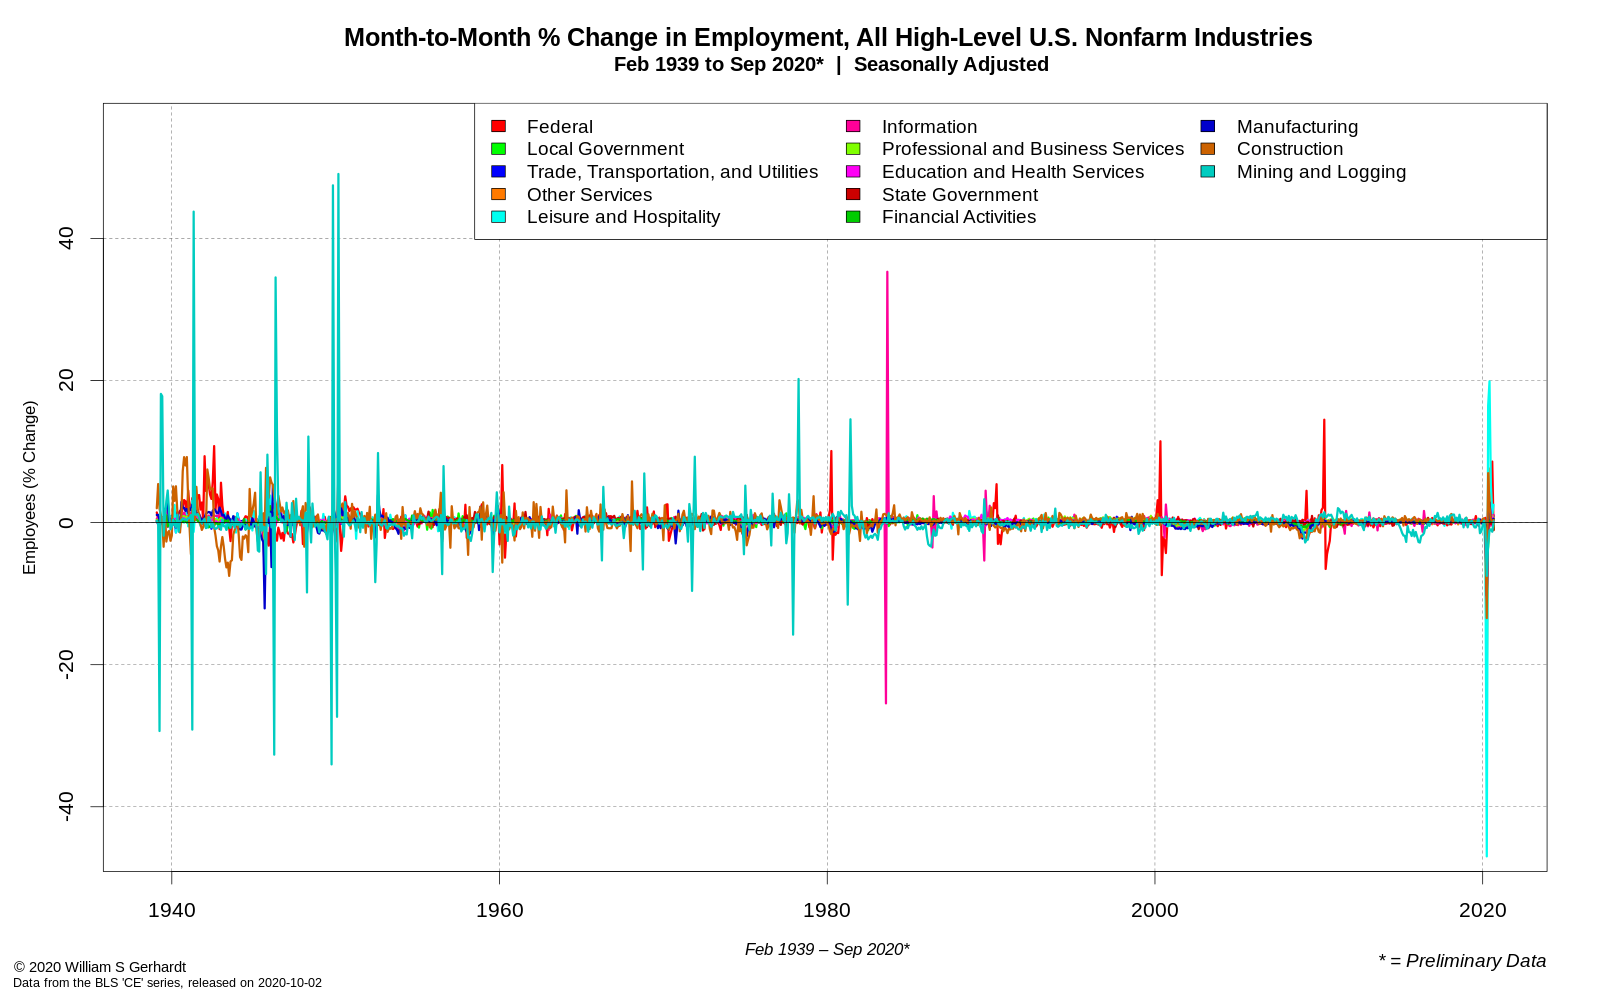
While the exact reasons for the surprising upward trend in employment in May and June is still a partial mystery—the likely combination of Federal stimulus, the rapid easing of lockdown restrictions, and the American consumer’s surprising interest in returning to businesses where they could contract COVID-19—the effect on the U.S. jobs market was undeniable: after the biggest month-to-month recorded drop in United States employment history, some sectors of the labor market experienced double-digit month-to-month gains; gains that look even more impressive when you observe the full history of month-to-month employment changes in the United States:
( Click for High Res )
the Leisure and Hospitality Industry. ( Click for High Res )
On the national level, nothing in the last 80 years resemble what happened this last Spring and Summer. On the industry level, certain industries have experienced the occasional wild swing in employment, such as the “Information” sector in the early 1980s and the “Mining and Logging” sector pre-1960.
And while the recovery started out looking “V-shaped”, in recent months the “V” is looking more and more like an “L” (as I discussed in a recent post) and employment gain in many states appear to be flattening out.
On Trend Analysis
While it’s generally a waste of time to predict the future, in this post I engage in an old-fashioned statistical pastime: speculative trend analysis. None of the charts below should be treated as anything but hypothetical “what if” scenarios, as the future is dependent on external factors not captured by the employment numbers themselves. The trend lines here do not capture underlying economic activity, government support for economic activities, the weather, labor force participation rates, COVID-19; they only project current or historic national trends into future: they don’t capture any of the things that may have caused or influenced those trends in the past.
Still, despite being purely speculative—as all trends effectively are—trends can sometimes give us a hint at what the future could hold if the past blindly repeats itself. If anything they can give us some nice-looking graphs.
The data here (minus the trend lines) comes from the most recent BLS Current Employment Survey. The graphs are—as always—auto-generated; produced from a few thousand breezy lines of original code, written in object-oriented R and Python. Here we go.
Three Thought Experiments
I added some simple trend lines to the BLS employment data to see what the economy could look like under three different scenarios:
- What the employment situation would look like if the massive employment jumps of May and June were to reoccur, beginning this month.
- A situation where employment grows at the rate it did in September 2020 (based on current preliminary numbers).
- A scenario where industry-level employment grows at the same rate it did during the period of Feb 2010 – Feb 2020 (when overall national employment hit a local low and local high, respectively).
None of these charts should be viewed as “predictions.” They can however, be viewed as thought experiments about what would happen if the rate of growth for major U.S. industries behaved in the future like they behaved in the near or immediate past.
There are no error or confidence boundaries surrounding these “predictions” lines, and no one should have any confidence in them: they show nothing more than what would happens in the highly unlikely event that the future behaves similar to certain periods of the past… and that the future behaves this way month after month until national employment returns to what it looked like in February 2020.
Graph #1: What a New V-Like Recovery Would Look Like
The trend shows what happens would happen to national nonfarm employment levels if the U.S. labor labor market were to repeat the massive growth spurt that occurred in the months following the April 2020 COVID-19 shutdowns. It’s the most hopeful graph of the three, and shows what a “rocket” or a “V-shaped” recovery would look like if things were to take off again this month (October 2020):
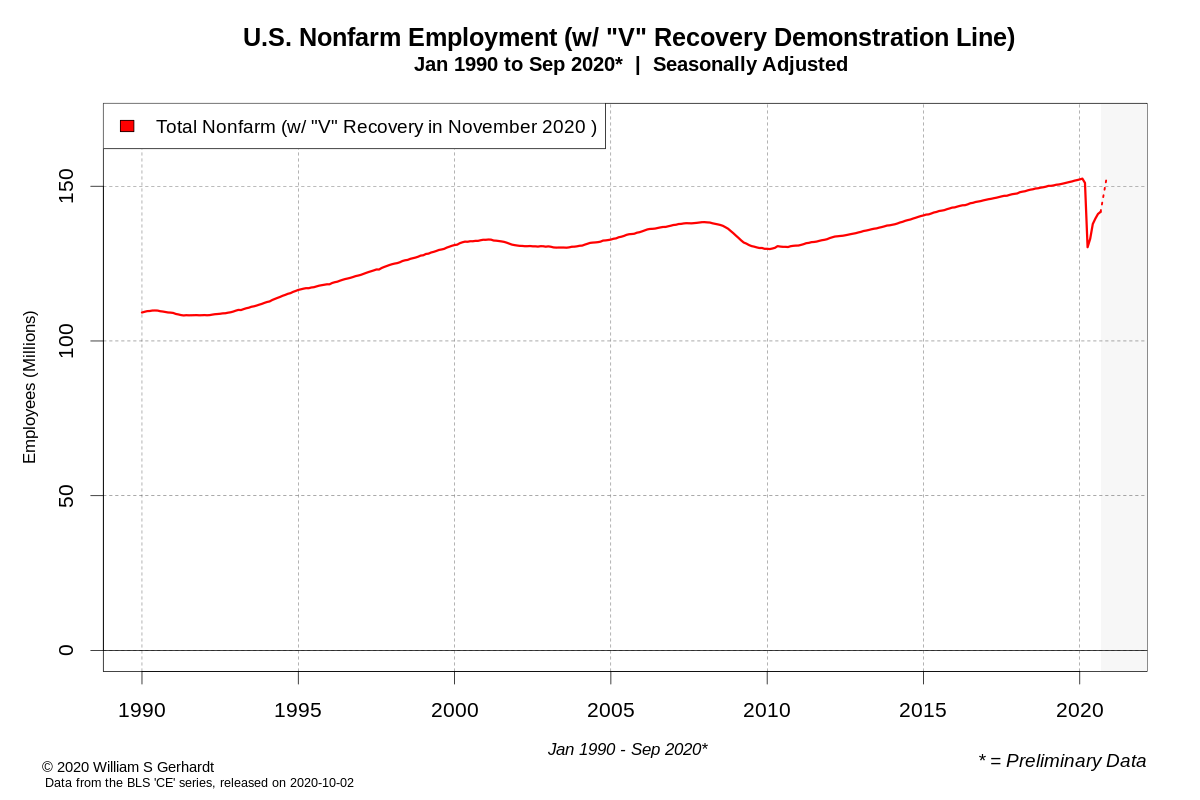
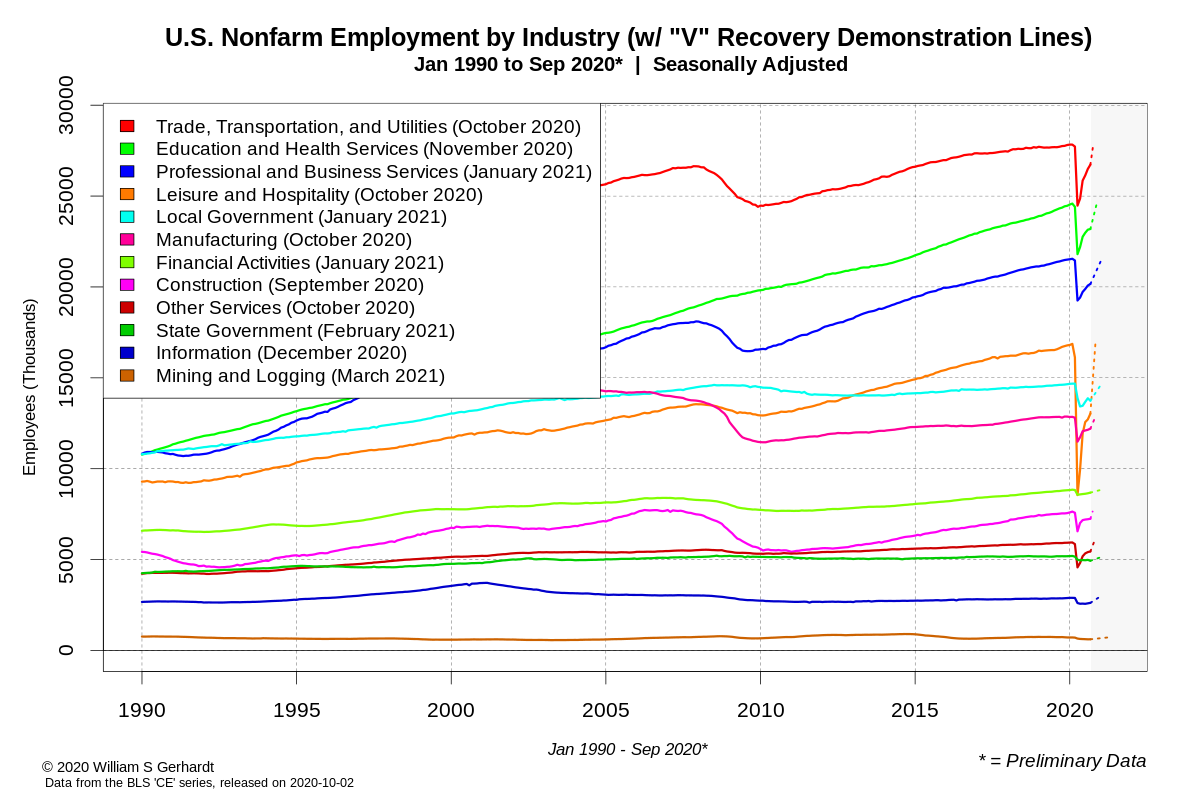
As this shows, if the growth for each impacted industry returned to the rate of growth in May or June 2020, most industries would return to February 2020 employment levels by the end of 2020.
Don’t hold your breath waiting for this to happen: given how the first surge in employment may have been aided, in part, by a massive injection of government stimulus funds, and given that no new round of stimulus has materialized, this scenario is unlikely to occur. COVID-19 has also not disappeared.
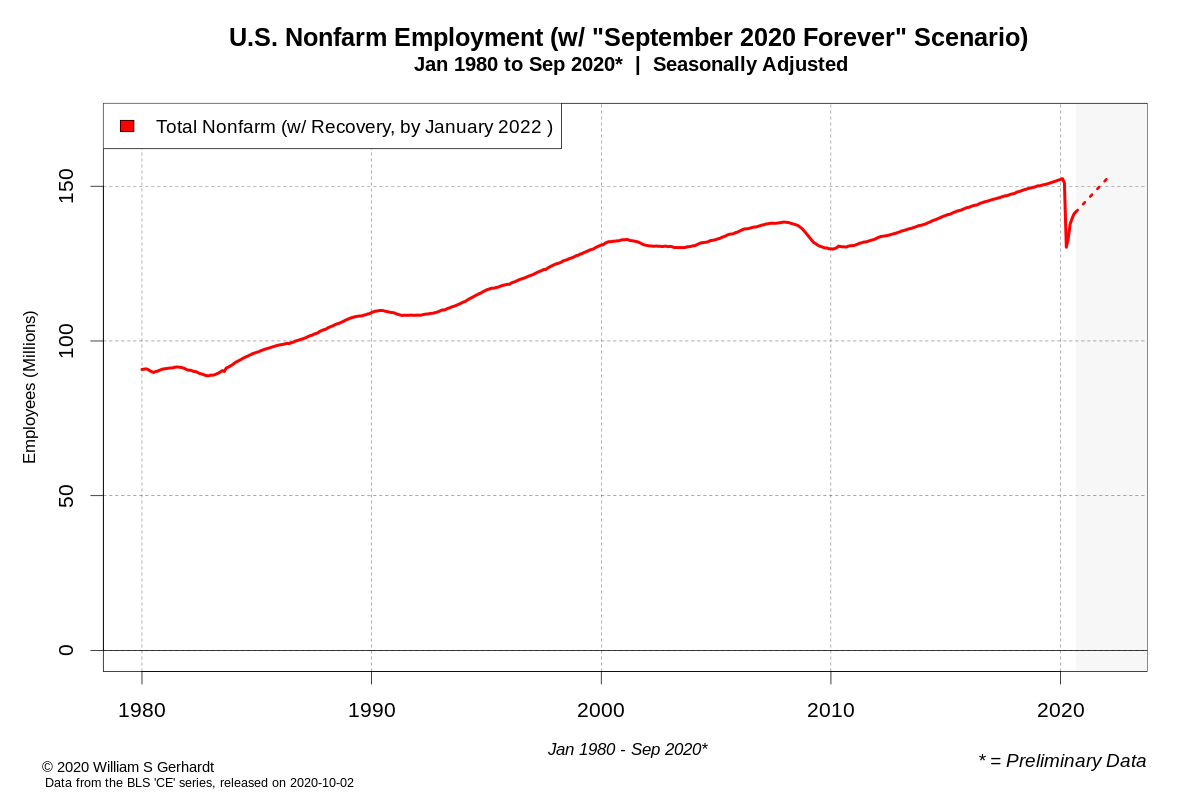
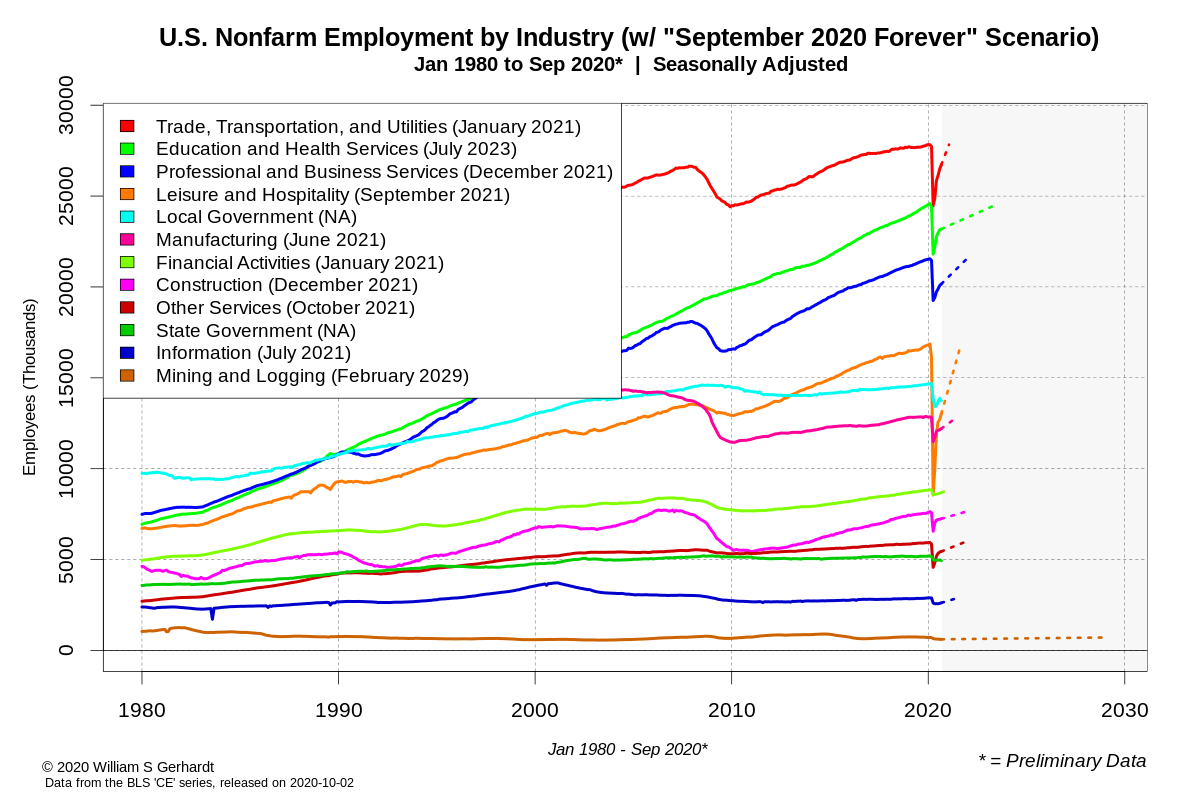
Graph #2: September 2020 Everlasting
Last month’s employment numbers had a slower rate of growth than previous months, and things are a long way away from a ‘V’-shaped recovery. Still, compared to some other scenarios (i.e. Graph #3) the prospect of a recovery by January 2022 looks rosy.
Graph #3: A Repeat of the Post-2008 Recovery
Using the trend lines for each industry for the period between February 2010 and February 2020, we can see a much bleaker scenario occurring: what might happen if, from here on out, the rate of employment growth returned to the rate of growth that occurred after the 2008 Financial Crisis:
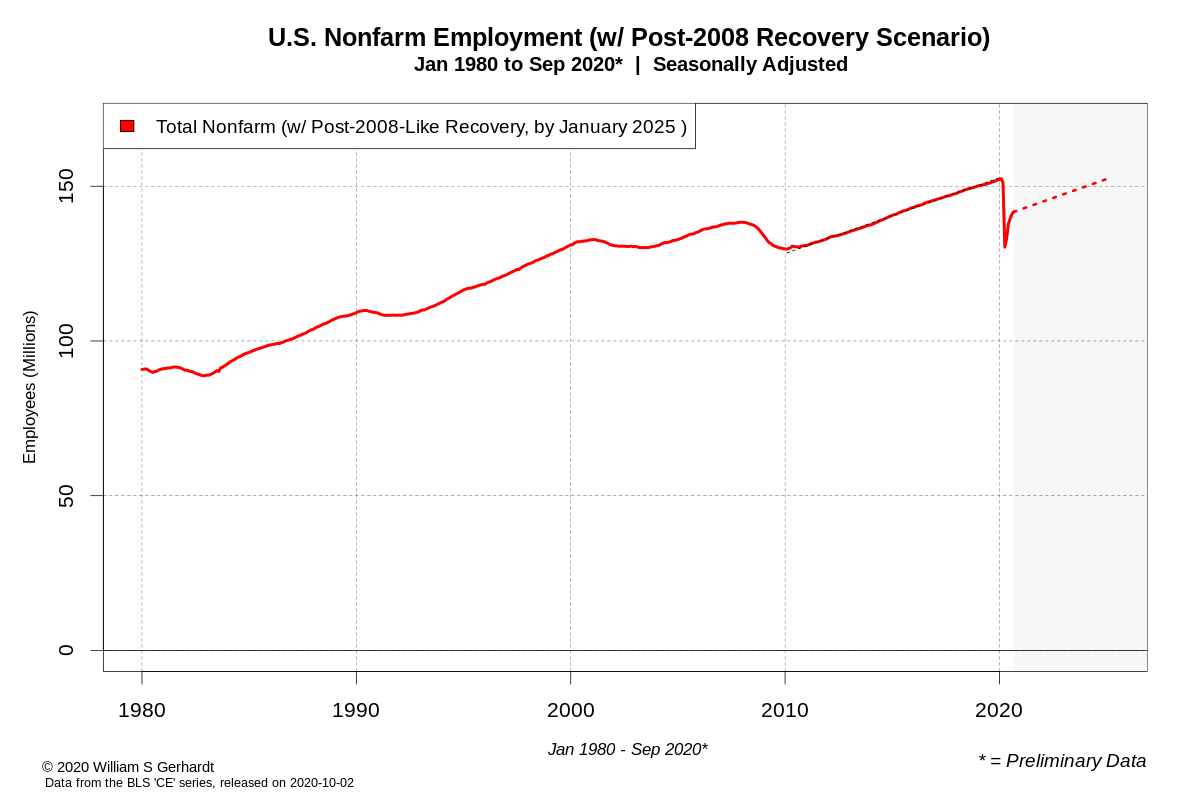
If this happens, the economy may not return to Feb 2020 levels of national employment until January 2025. Industry-level employment under this scenario would turn out only marginally better:
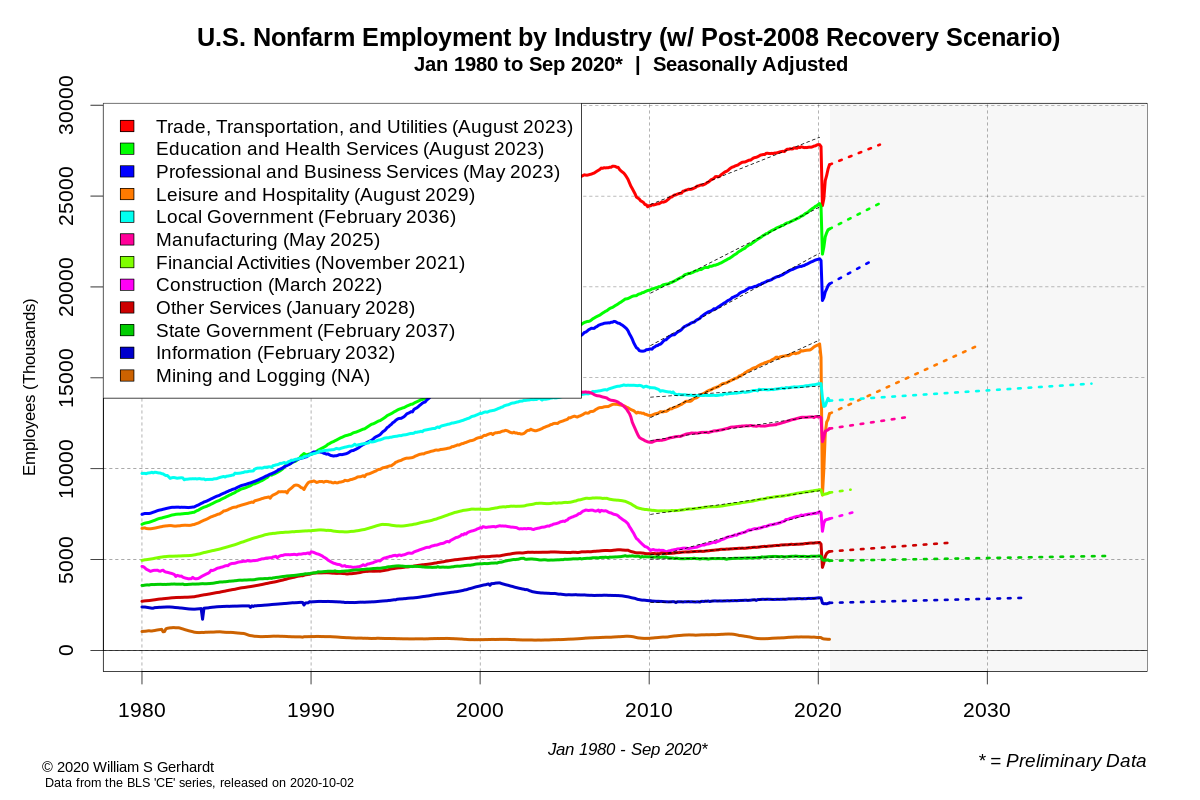
To show how the trend lines were generated here, these graphs include the fitted regression line the trend was built on in the form of a thin dashed line. The seasonally adjusted trend was generated independently for each industry.
February 2010 and February 2020 were chosen as the boundary years for the fitted line, as this was the most recent period when national employment was clearly at a relative min and max. (Note: Federal Government employment was removed from the seasonally adjusted industry-level trend examples here—the only industry missing—as the 10-year periodic surge in Federal government census hiring makes it temporarily immune from meaningful trend analysis).
While there is no reason to believe (or, for that matter, not believe) that the 2020s will look like the 2010s, if the current recovery turns out like the 2008 recovery many industries may not return to their Feb 2020 period of employment for years; possibly a decade or more.
Reasons for Optimism
While the graphs above are nothing but thought experiments and predict nothing, given the remarkable initial rebound from the April 2020 employment crash it is still a possibility that history could repeat itself and that the current crisis could be a fleeting one. If anything, thanks to what happened in May and June of 2020 we know that a massive rebound in employment is at least theoretically possible.
Adding to hope, there is no sign at the moment that the current economic crisis will morph into a banking crisis similar to 2008 (though it could still become one). Still if the seemingly boundless exuberance in public markets means anything, the economy could return to full employment after another one or two rounds of targeted stimulus without issue.
(Still, while historically the media likes to use the stock market as a marker for economic health, and the U.S. stock market in 2020 has been surprisingly strong, all gold rushes come to an end eventually; and sometimes they come to an end like they do in the 2018 film “The Sisters Brothers.”)
The future of U.S. employment could be strong, though it may be largely dependent on our government. At the moment 11% of American households appear to be self-reporting that they do not have enough food, and it’s unclear what the future will looks like if a tenth of the population is rendered hungry or homeless by COVID-19. A miraculous V-like recovery is still possible, but the risks of things going the opposite direction are palpable.
Coming Up
State level BLS employment data for September is released next Tuesday. I also have a post planned to look at the newest U.S. Household Pulse survey provided by the U.S. Census. Please wear a mask.