U.S. employment is looking stuck in a rut. Preliminary data from the Bureau of Labor Statistics show that the national job market continued to lose stream in November 2020 after months of consecutive de-acceleration. Seasonally adjusted job growth in many industries flattened again in November and a rapid recovery to February 2020 levels of employment appears to be increasingly out of reach:
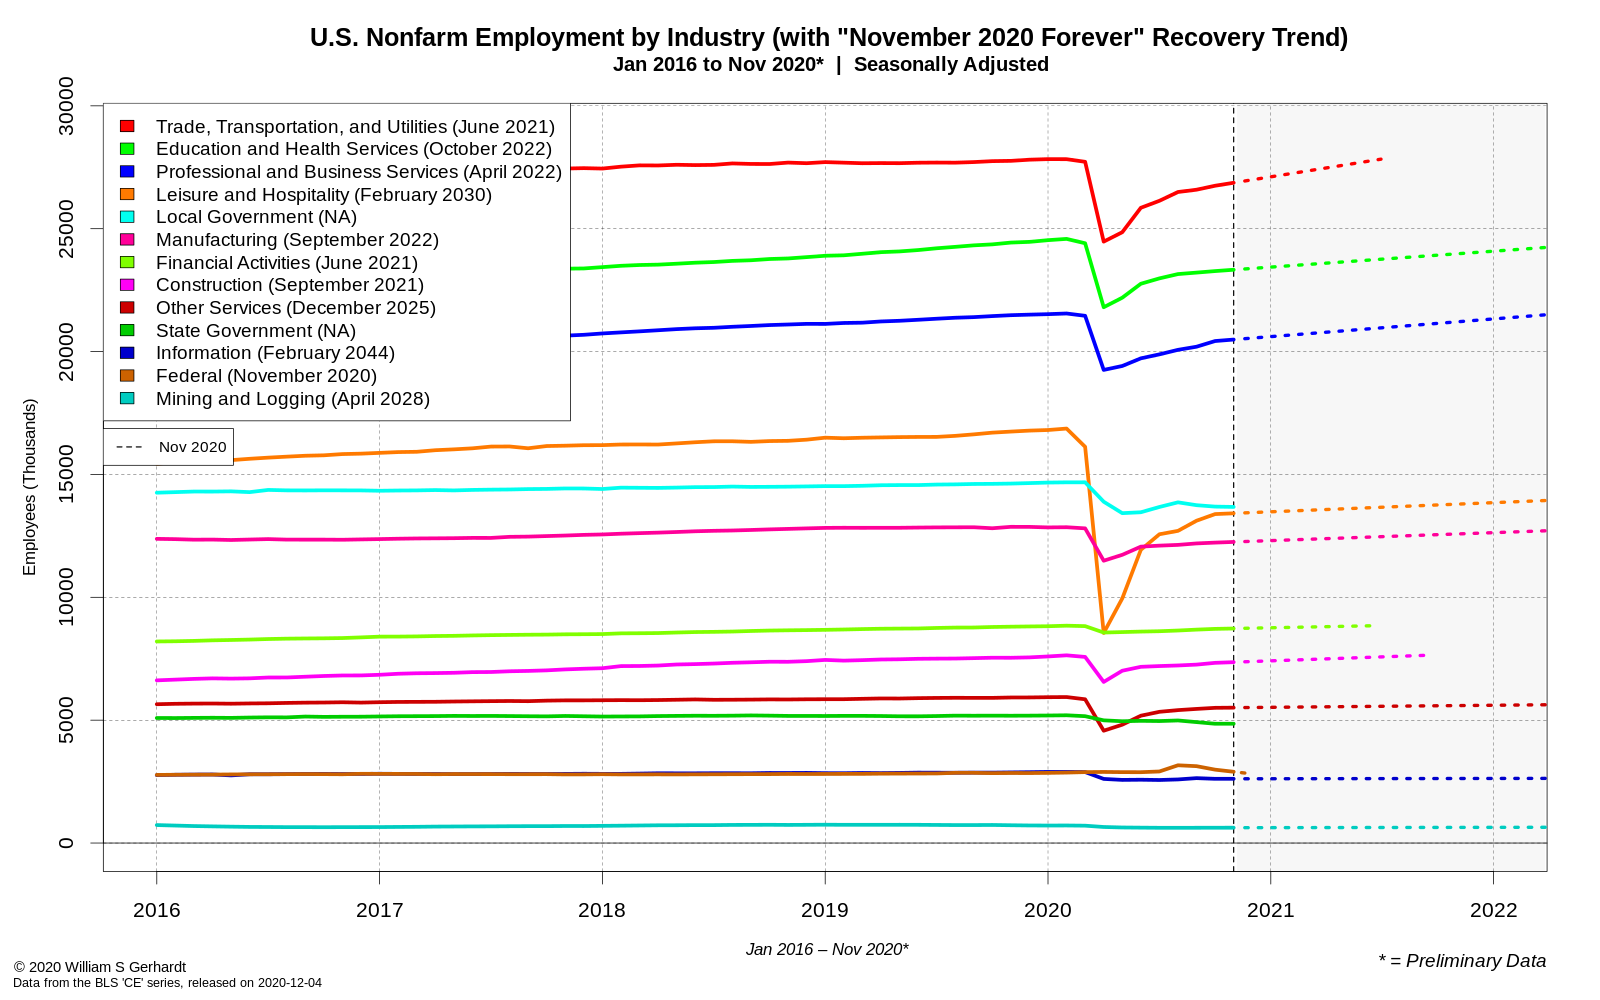
A quick note on nomenclature: The dotted lines in these graphs are non-regression trend lines – based only on the rate of growth between October and November – and show how many months it will take (at the current rate) before there is a return to Feb 2020 levels of employment. Industry specific projection dates can be found on the legend, (in parentheses). These trend lines are for demonstration purposes only, and are not intended to be predictions.
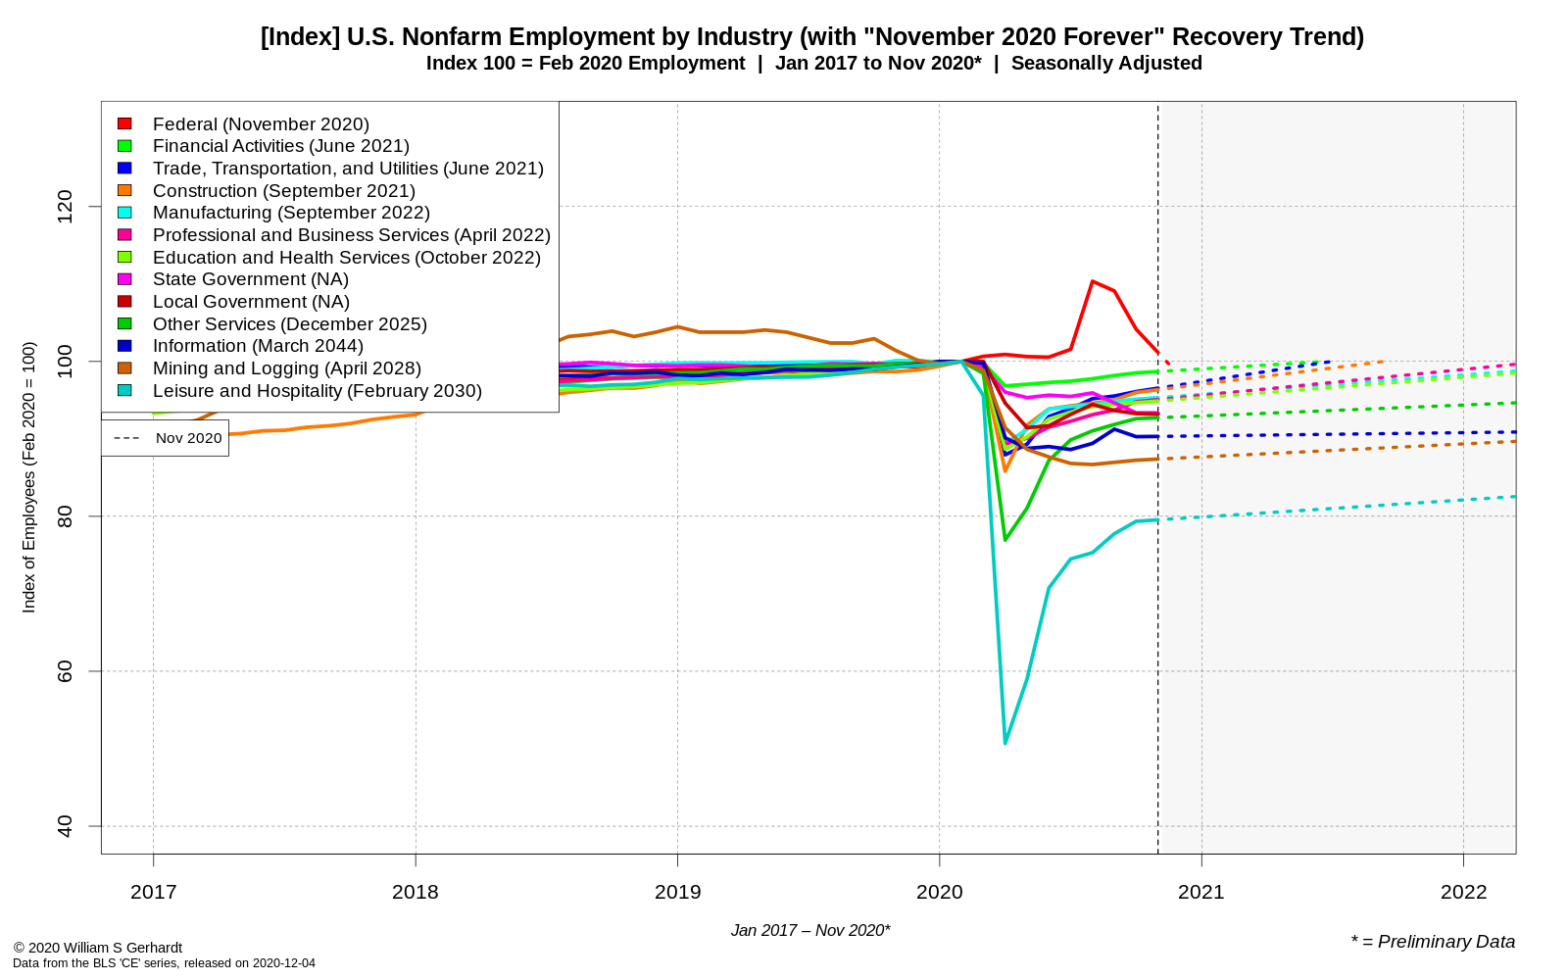
Comparing different industries across time is often made easier if we convert the data into an index (as the BLS does in some of its series), with 100 representing the seasonally adjusted employment at a given date, and the surrounding values representing a % difference from that date.
In the graph below I set the index as “100 = February 2020”, and by doing this we can see which industries dropped the most since then, and how close they are to Februrary 2020 levels of employment:

The Federal employment bump brought on by the 2020 Census now appears to be gone, and of all industries Leisure and Hospitality continued to be the biggest loser: seasonally adjusted employment has almost completely ground to a halt in that sector. Mining and Logging are also still hurting, and job growth in the information sector is dead in the water.
Taking a closer look at the Information sector, we can clearly see where the problems in this industry group are located: almost everywhere.

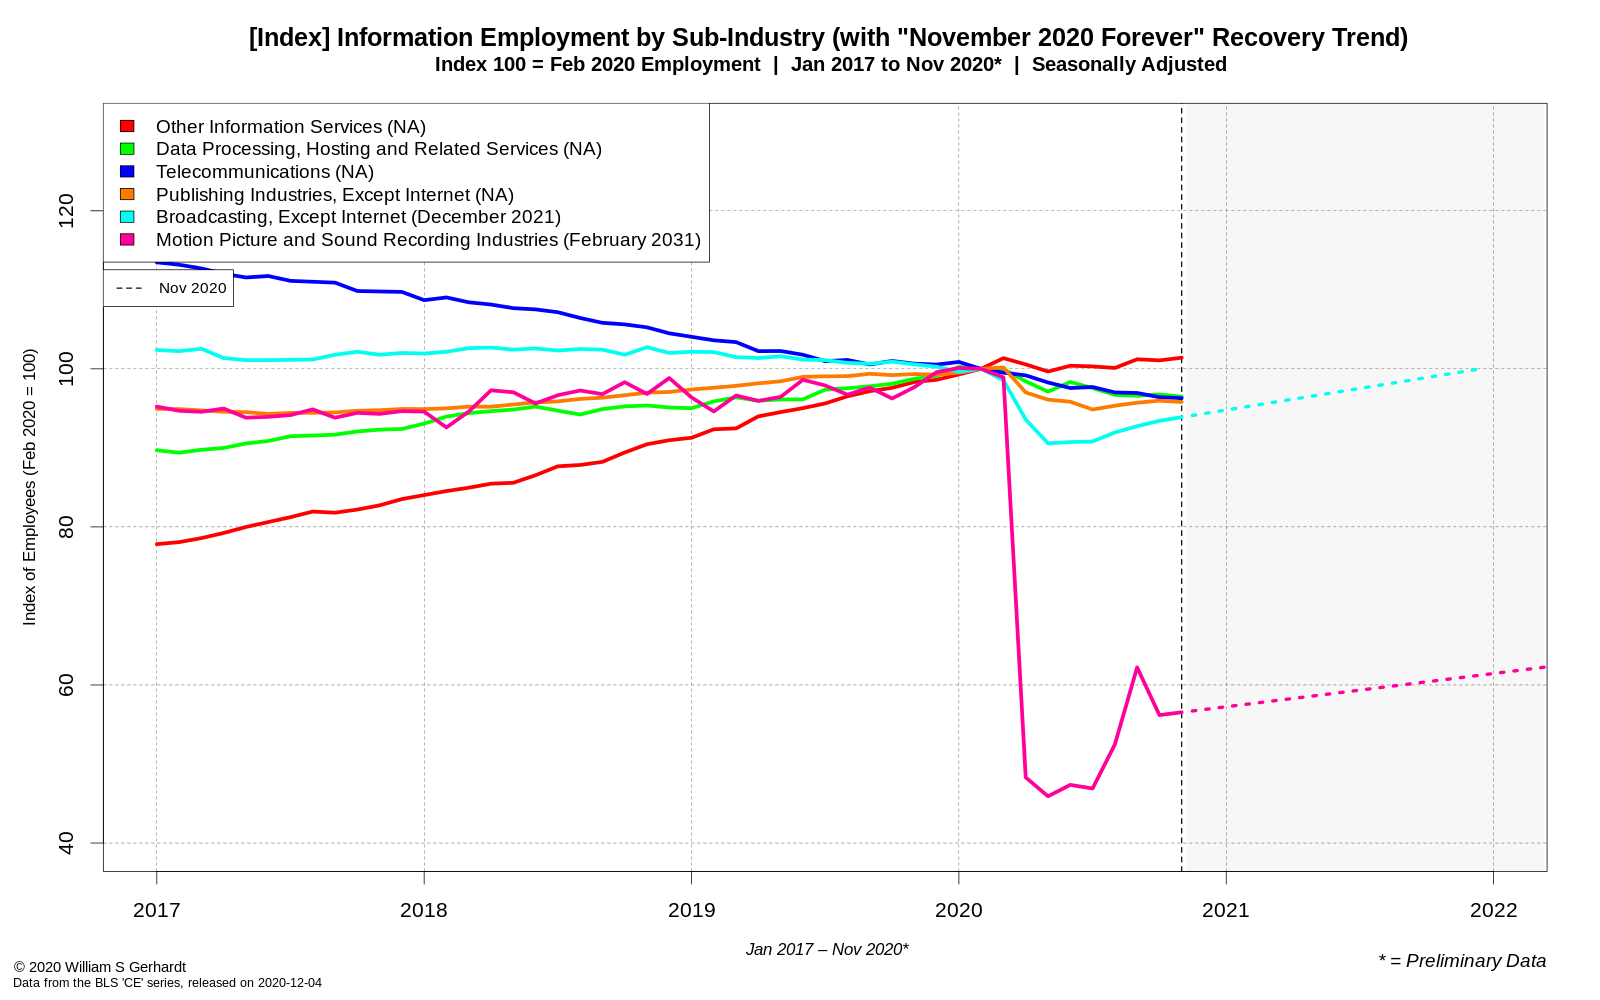
And you are reading the legend correctly: The Motion Picture and Sound Recording Industries will not return to Feb 2020 employment levels until February 2031 if last month’s rate of job growth remains constant and the film theater industry sticks around.
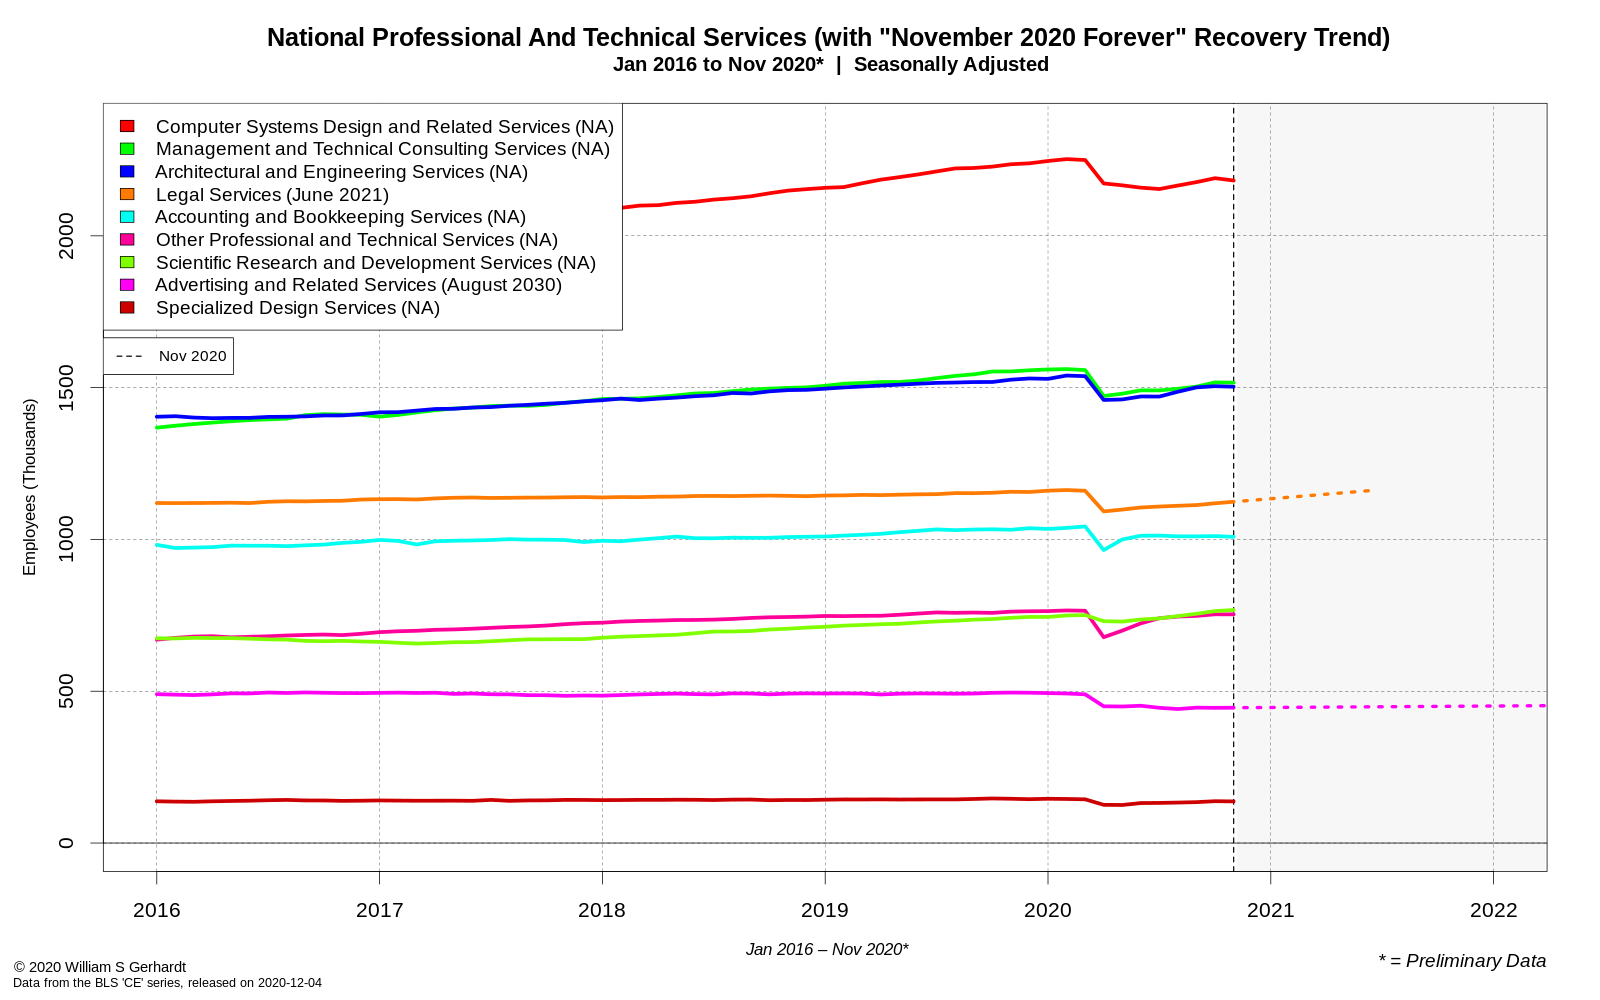
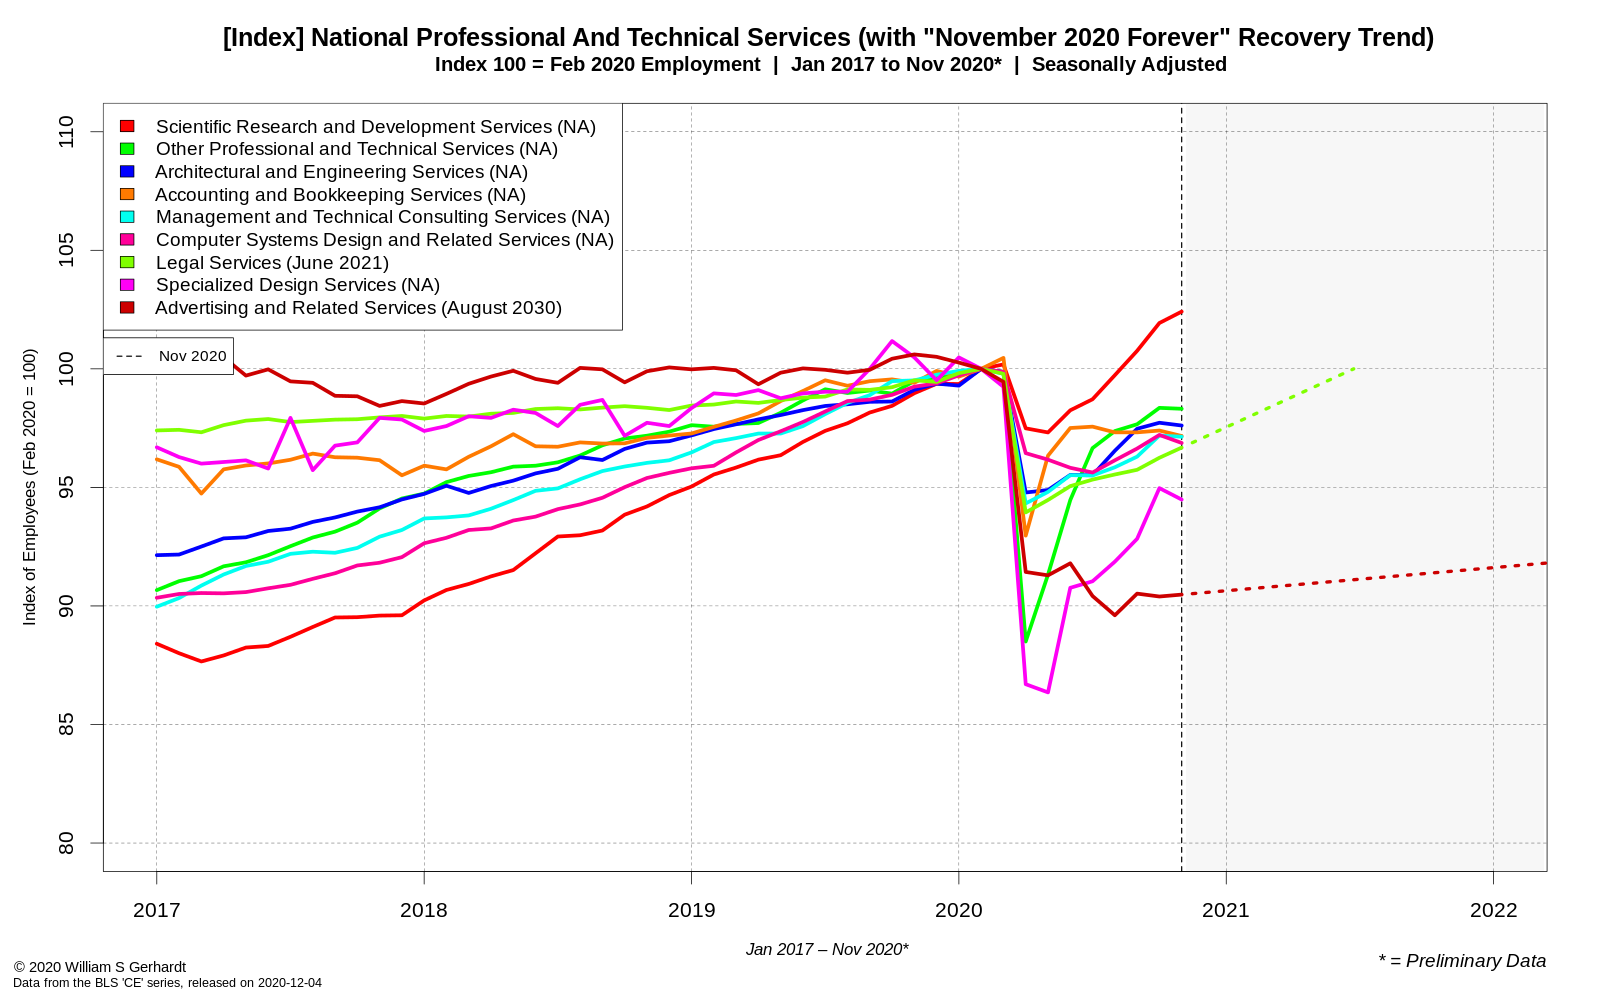
Another BLS sector, Professional and Technical Services (a subsector of Professional and Business Services), also appears to be hitting a rough patch with only advertising, legal service, and scientific research gaining jobs in the preliminary November numbers.
Keep on the Sunny Side
Despite the bleak picture not all is bad! The largest sector in the U.S. economy, “Trade, Transportation, and Utilities”, keeps on chugging along after all. What does the zoom-in of that sector look like though?
On deep look, it becomes apparent that all the growth in this sector last month came from transportation and warehousing and Retail Trade, and that signs of recovery in Retail are gone. Wholesale trade is also lagging.
A deep look at the construction sector though has to offer some good news, right? Seasonally adjusted construction appears to be going well, after all.
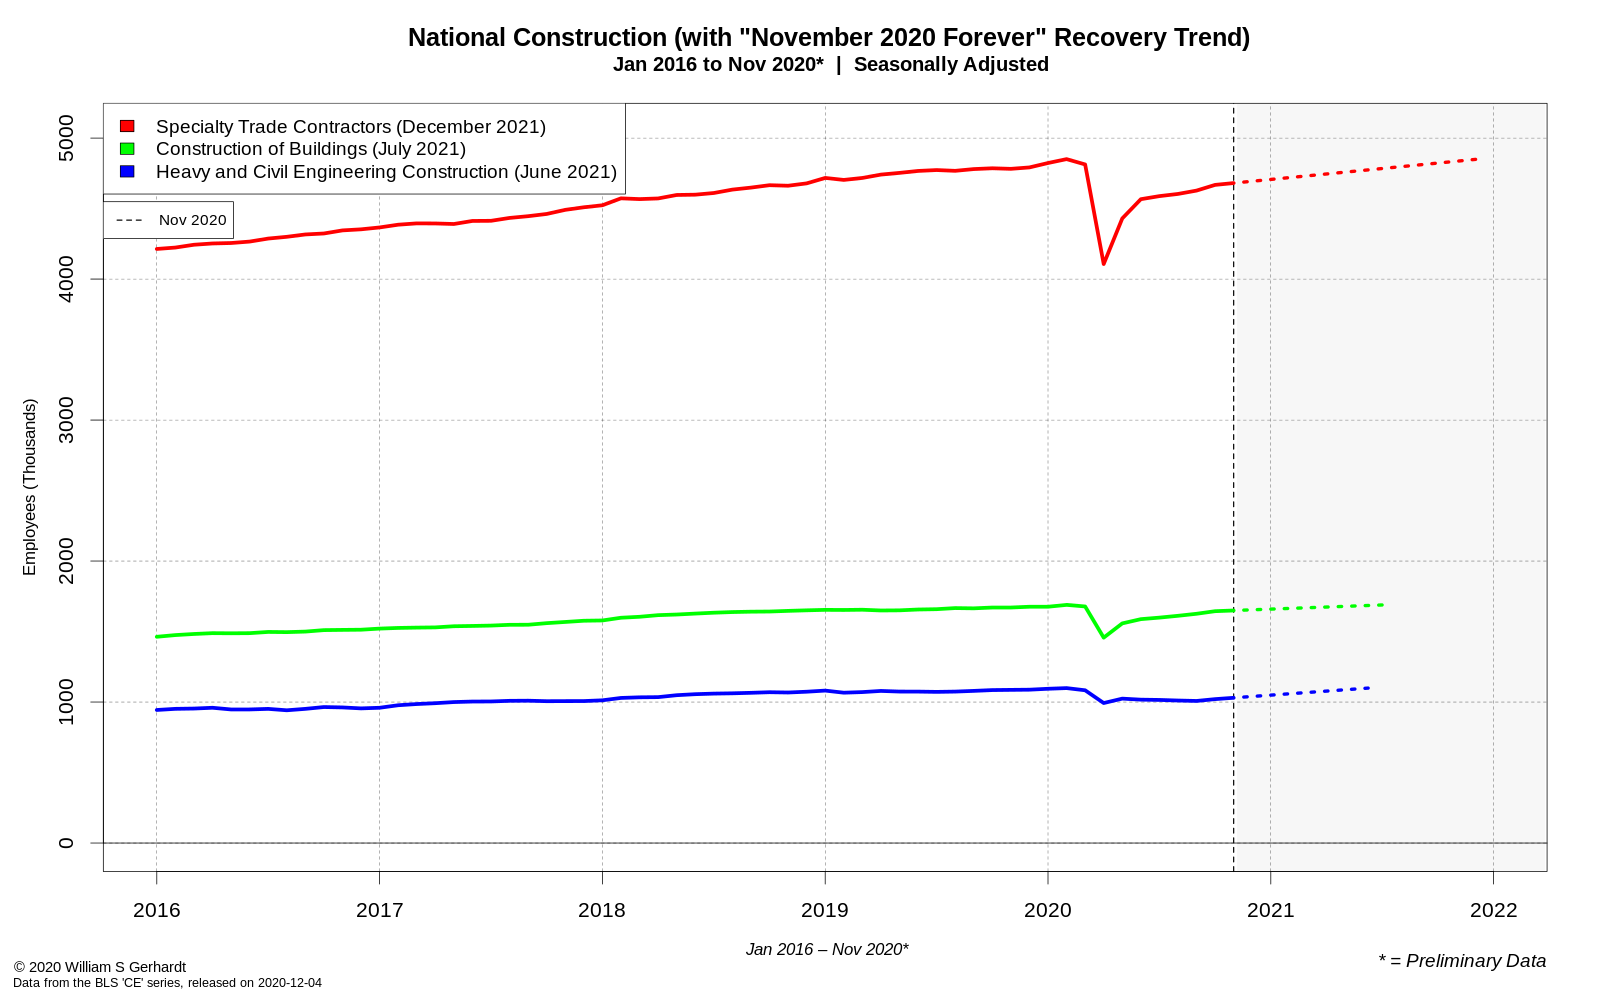
So yes, there is some good news: for people in construction, at the current rate of growth some people may only have to wait another another full year to be employed again. (related link)
Final Thought
It’s unclear what industries would be impacted by any deeper economic slowdown due to COVID-19 or from unrelated economics shocks. There is still a great deal of uncertainty, and given that federal stimulus dollars have been virtually nonexistent for 5 months and counting it’s anyone’s guess what will happen next.
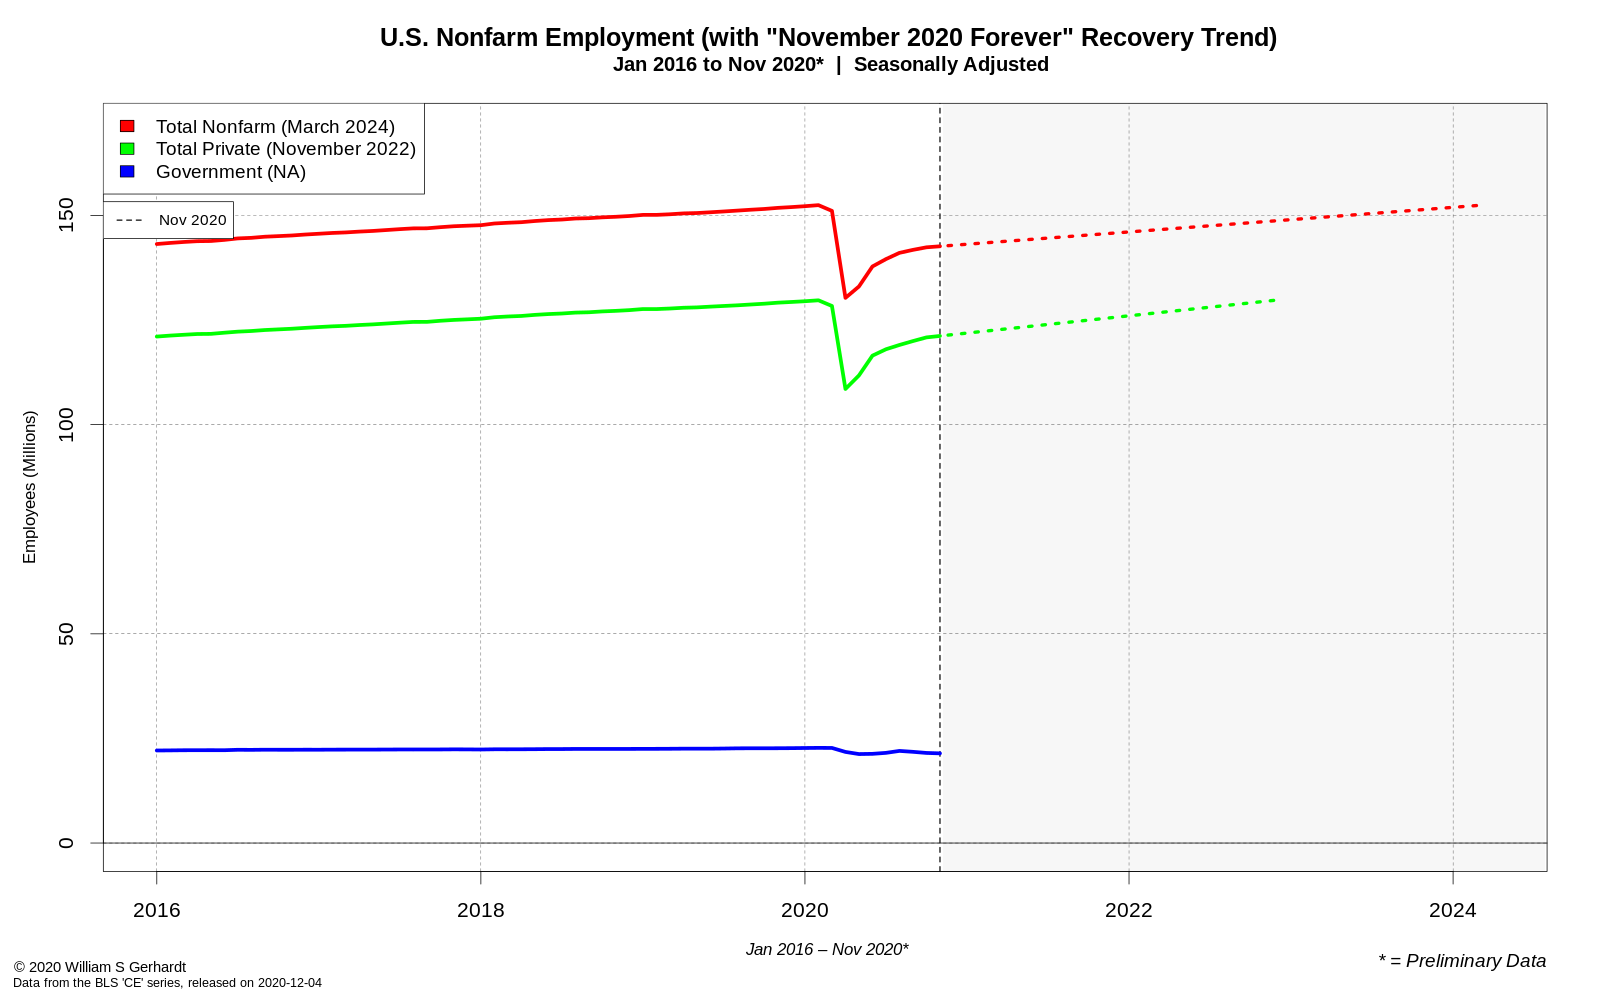
Whatever happens, hopefully we will not have to wait until March 2024 before seasonally adjusted total nonfarm U.S. employment returns to February 2020 levels. Because if you believe the preliminary numbers for November, that is how things are currently trending:
Tools & Methods
- Data Processing: Initial data extraction from BLS data files was done via a custom Python data warehouse and an automated ETL.
- Graphs: The graphs—always a work in progress—were generated using automated graphic tools I developed using only Vim and base R.