
In 2021 I tried to create a data application in R using Java-style object-oriented programming. It worked, but there was a problem…
Author Archives: William Gerhardt
News Commentary: Is the Press Rooting for a Financial Crisis?
Credit Suisse had been in trouble for years; Silicon Valley Bank was a textbook bank run; Signature Bank was facing a criminal probe. Why has the press been reporting events with no obvious systemic impact as a systemic crisis?
We Should Stop Discounting the Risks Posed by Covid-19

With the pandemic 2.5 years old and still going strong, ignoring the risks of Long Covid is a bad proposition.
Data Engineering: Hive is not a Data Warehouse. So what exactly is it?

Organizations trying to develop a “data warehouse” with Hadoop-based solutions may be surprised to discover these products lack standard data warehouse features.
WordPress Spam (Volume 1)
Back in October I opened one of my posts to comments. The bot submissions I got were entertaining. I share some of them.
Graphical Analysis: Job Growth in Most U.S. Industries Flatlined in November 2020
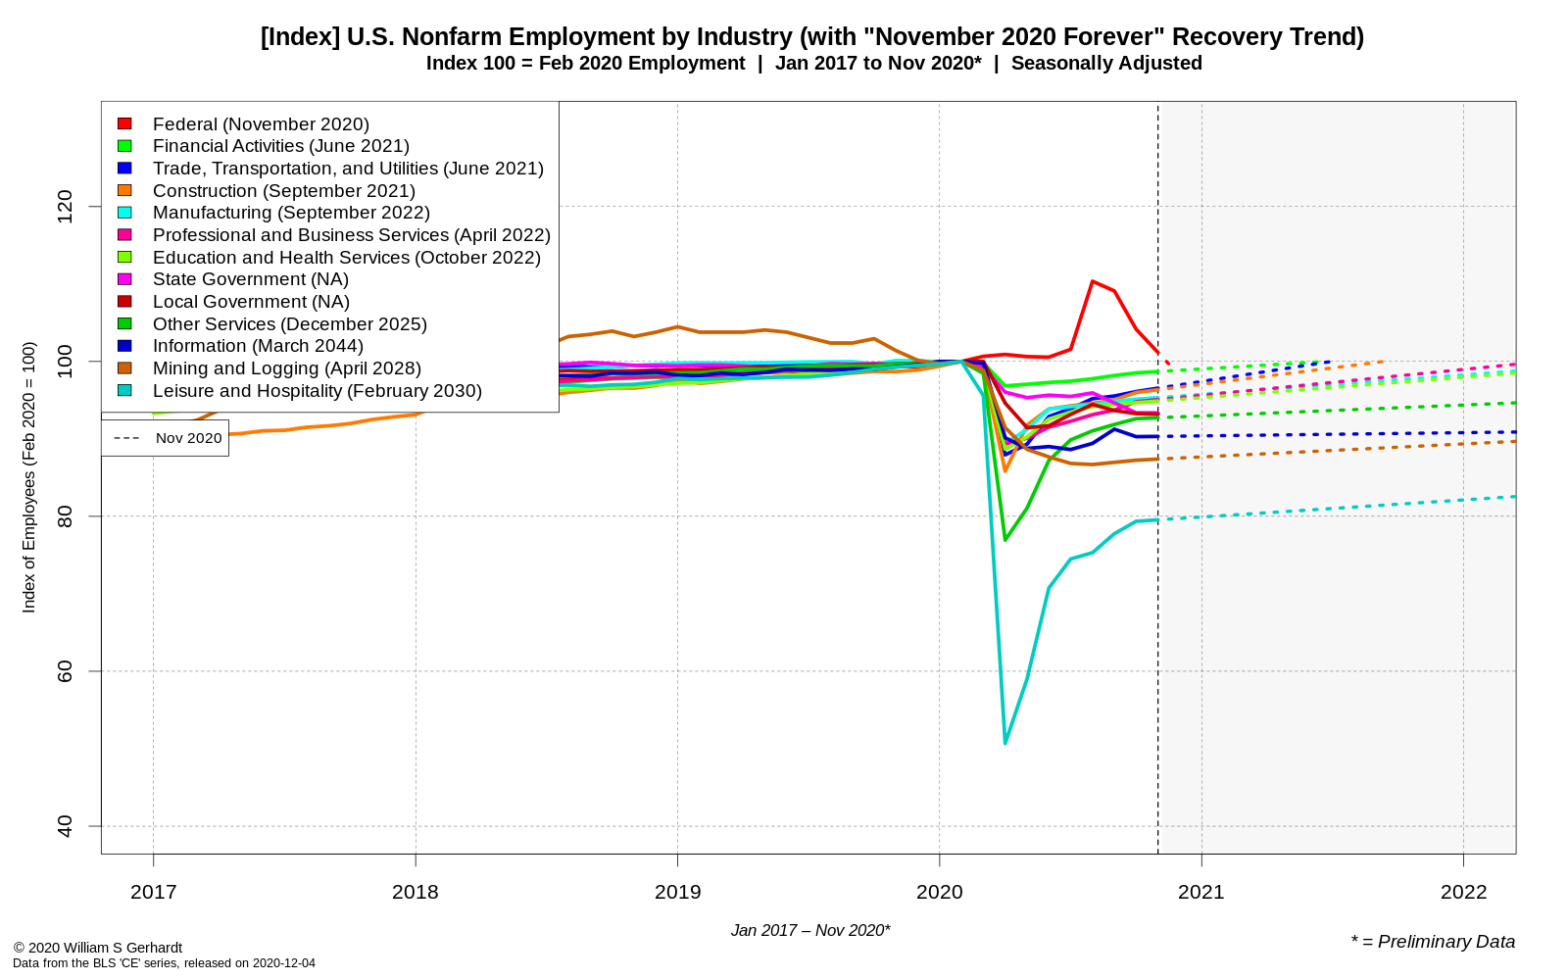
The COVID-19 employment roller coaster just took another turn, and the job growth we saw in Summer and Fall 2020 appears to be at an end.
Graphical Analysis: New State Job Numbers Show a Nation in Flux
In this post I take a look at the new September 2020 state-level employment data provided by the Bureau of Labor Statistics (BLS) and find a complex and tenuous jobs recovery in America. I share some of the most interesting numbers in original graphs.
Employment Trends: A Full Recovery in 2020 is Possible, but may be Unlikely
While employment growth slowed in September 2020, the industry employment numbers over the summer suggest that an American labor market, without COVID-19, could quickly rebound. I explore some different employment growth scenarios.
The September 2020 National U.S. Employment Numbers in Four Graphs
The major takeaways: All sectors but the Federal Government are still down significantly from their peak employment on February 2020; only the Financial Services sector is close to being “recovered”; the Leisure and Hospitality sector is continuing to suffer from double-digit employment losses but is growing quickly.
Graphical Analysis: State-Level U.S. Employment is Failing to “Bounce Back”
I look at the August 2020 state-level employment data from the Bureau of Labor Statistics (BLS) and find generally lackadaisical employment numbers in both large and small states. This is my first look at the state-level and local-level data provided by the BLS, and was done using original data tools that can process and manage large multi-dimensional time series datasets.